CanaanInc CAN full analysis,charts,indicators,moving averages,SMA,DMA,EMA,ADX,MACD,RSICanaan Inc CAN WideScreen charts, DMA,SMA,EMA technical analysis, forecast prediction, by indicators ADX,MACD,RSI,CCI NASDAQ stock exchange
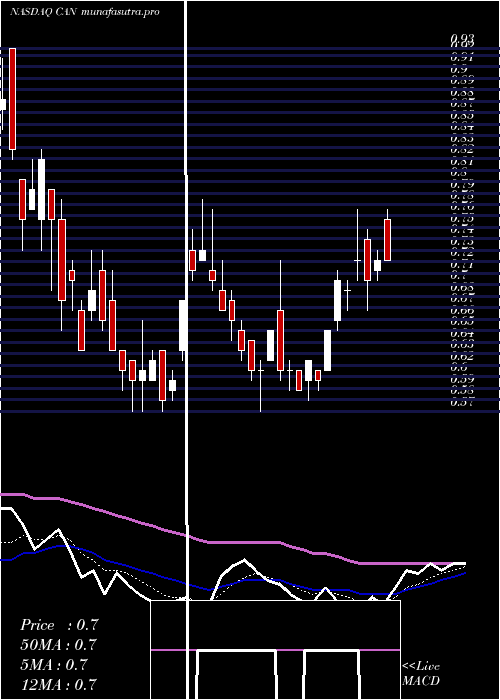
Daily price and charts and targets CanaanInc Strong Daily Stock price targets for CanaanInc CAN are 1.48 and 1.8 | Daily Target 1 | 1.23 | | Daily Target 2 | 1.41 | | Daily Target 3 | 1.55 | | Daily Target 4 | 1.73 | | Daily Target 5 | 1.87 |
Daily price and volume Canaan Inc
| Date |
Closing |
Open |
Range |
Volume |
Fri 17 October 2025 |
1.59 (-4.22%) |
1.48 |
1.37 - 1.69 |
0.8344 times |
Thu 16 October 2025 |
1.66 (-15.31%) |
2.00 |
1.64 - 2.10 |
0.7722 times |
Wed 15 October 2025 |
1.96 (8.89%) |
2.03 |
1.68 - 2.05 |
1.6483 times |
Tue 14 October 2025 |
1.80 (18.42%) |
1.41 |
1.39 - 1.86 |
1.3995 times |
Mon 13 October 2025 |
1.52 (39.45%) |
1.15 |
1.14 - 1.53 |
1.0457 times |
Fri 10 October 2025 |
1.09 (-10.66%) |
1.27 |
1.07 - 1.38 |
1.1732 times |
Thu 09 October 2025 |
1.22 (-4.69%) |
1.28 |
1.18 - 1.32 |
0.5745 times |
Wed 08 October 2025 |
1.28 (0.79%) |
1.31 |
1.21 - 1.35 |
0.77 times |
Tue 07 October 2025 |
1.27 (-5.22%) |
1.36 |
1.22 - 1.45 |
0.8762 times |
Mon 06 October 2025 |
1.34 (1.52%) |
1.42 |
1.28 - 1.53 |
0.906 times |
Fri 03 October 2025 |
1.32 (-1.49%) |
1.44 |
1.26 - 1.60 |
1.4223 times |
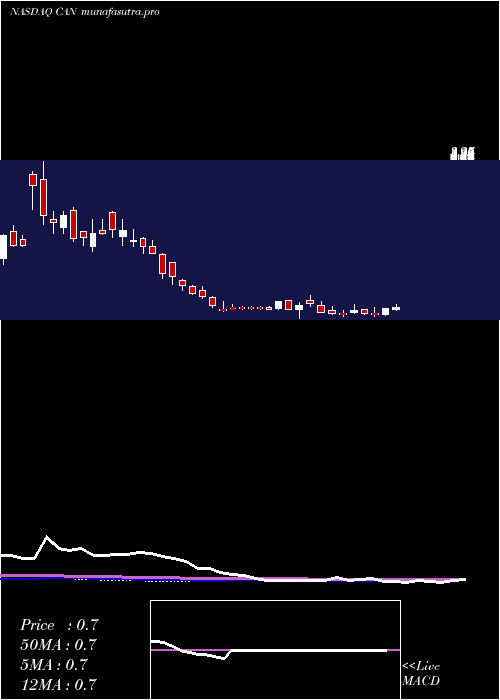
Weekly price and charts CanaanInc Strong weekly Stock price targets for CanaanInc CAN are 1.37 and 2.33 | Weekly Target 1 | 0.65 | | Weekly Target 2 | 1.12 | | Weekly Target 3 | 1.61 | | Weekly Target 4 | 2.08 | | Weekly Target 5 | 2.57 |
Weekly price and volumes for Canaan Inc
| Date |
Closing |
Open |
Range |
Volume |
Fri 17 October 2025 |
1.59 (45.87%) |
1.15 |
1.14 - 2.10 |
2.2346 times |
Fri 10 October 2025 |
1.09 (-17.42%) |
1.42 |
1.07 - 1.53 |
1.6857 times |
Fri 03 October 2025 |
1.32 (67.09%) |
0.84 |
0.84 - 1.60 |
2.0251 times |
Fri 26 September 2025 |
0.79 (1.28%) |
0.75 |
0.73 - 0.91 |
1.0389 times |
Fri 19 September 2025 |
0.78 (-4.88%) |
0.83 |
0.77 - 0.85 |
0.7221 times |
Fri 12 September 2025 |
0.82 (15.49%) |
0.71 |
0.70 - 0.84 |
0.6335 times |
Fri 05 September 2025 |
0.71 (-5.33%) |
0.73 |
0.68 - 0.75 |
0.3849 times |
Fri 29 August 2025 |
0.75 (0%) |
0.76 |
0.73 - 0.76 |
0.0608 times |
Fri 29 August 2025 |
0.75 (0%) |
0.72 |
0.72 - 0.80 |
0.4095 times |
Fri 22 August 2025 |
0.75 (-2.6%) |
0.75 |
0.64 - 0.77 |
0.8049 times |
Fri 15 August 2025 |
0.77 (5.48%) |
0.76 |
0.71 - 0.82 |
0.9343 times |
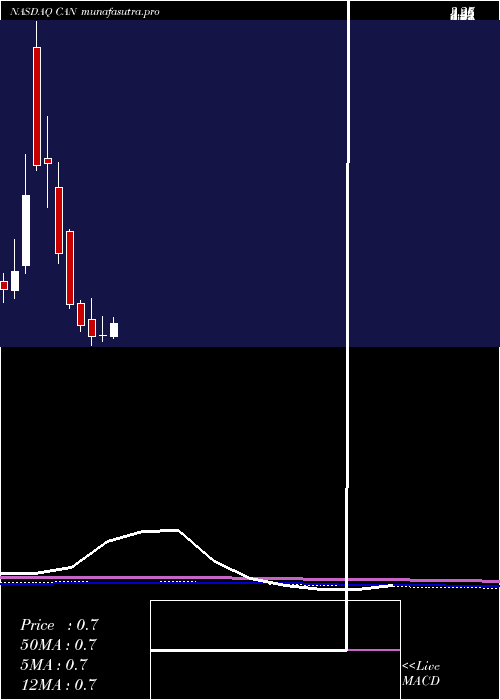
Monthly price and charts CanaanInc Strong monthly Stock price targets for CanaanInc CAN are 1.25 and 2.45 | Monthly Target 1 | 0.33 | | Monthly Target 2 | 0.96 | | Monthly Target 3 | 1.53 | | Monthly Target 4 | 2.16 | | Monthly Target 5 | 2.73 |
Monthly price and volumes Canaan Inc
| Date |
Closing |
Open |
Range |
Volume |
Fri 17 October 2025 |
1.59 (80.68%) |
0.92 |
0.90 - 2.10 |
1.9367 times |
Tue 30 September 2025 |
0.88 (17.33%) |
0.73 |
0.68 - 0.96 |
1.1681 times |
Fri 29 August 2025 |
0.75 (8.7%) |
0.67 |
0.62 - 0.82 |
1.0285 times |
Thu 31 July 2025 |
0.69 (11.29%) |
0.61 |
0.59 - 1.12 |
1.8561 times |
Mon 30 June 2025 |
0.62 (1.64%) |
0.62 |
0.57 - 0.78 |
0.905 times |
Fri 30 May 2025 |
0.61 (-12.86%) |
0.75 |
0.53 - 0.93 |
1.1985 times |
Wed 30 April 2025 |
0.70 (-20.45%) |
0.89 |
0.65 - 0.91 |
0.4476 times |
Mon 31 March 2025 |
0.88 (-32.82%) |
1.50 |
0.85 - 1.51 |
0.4846 times |
Fri 28 February 2025 |
1.31 (-36.71%) |
1.87 |
1.23 - 2.08 |
0.3453 times |
Fri 31 January 2025 |
2.07 (0.98%) |
2.11 |
1.70 - 2.47 |
0.6297 times |
Tue 31 December 2024 |
2.05 (13.89%) |
3.05 |
2.01 - 3.27 |
0.5135 times |
DMA SMA EMA moving averages of Canaan Inc CAN
DMA (daily moving average) of Canaan Inc CAN
| DMA period | DMA value | | 5 day DMA | 1.71 | | 12 day DMA | 1.45 | | 20 day DMA | 1.21 | | 35 day DMA | 1.02 | | 50 day DMA | 0.93 | | 100 day DMA | 0.82 | | 150 day DMA | 0.81 | | 200 day DMA | 1.04 | EMA (exponential moving average) of Canaan Inc CAN
| EMA period | EMA current | EMA prev | EMA prev2 | | 5 day EMA | 1.62 | 1.64 | 1.63 | | 12 day EMA | 1.45 | 1.42 | 1.38 | | 20 day EMA | 1.31 | 1.28 | 1.24 | | 35 day EMA | 1.14 | 1.11 | 1.08 | | 50 day EMA | 0.99 | 0.97 | 0.94 |
SMA (simple moving average) of Canaan Inc CAN
| SMA period | SMA current | SMA prev | SMA prev2 | | 5 day SMA | 1.71 | 1.61 | 1.52 | | 12 day SMA | 1.45 | 1.4 | 1.34 | | 20 day SMA | 1.21 | 1.17 | 1.12 | | 35 day SMA | 1.02 | 0.99 | 0.97 | | 50 day SMA | 0.93 | 0.92 | 0.9 | | 100 day SMA | 0.82 | 0.81 | 0.8 | | 150 day SMA | 0.81 | 0.8 | 0.8 | | 200 day SMA | 1.04 | 1.04 | 1.04 |
|
|
