CaInc CA full analysis,charts,indicators,moving averages,SMA,DMA,EMA,ADX,MACD,RSICa Inc CA WideScreen charts, DMA,SMA,EMA technical analysis, forecast prediction, by indicators ADX,MACD,RSI,CCI NASDAQ stock exchange
operates under Technology sector & deals in Computer Software: Prepackaged Software
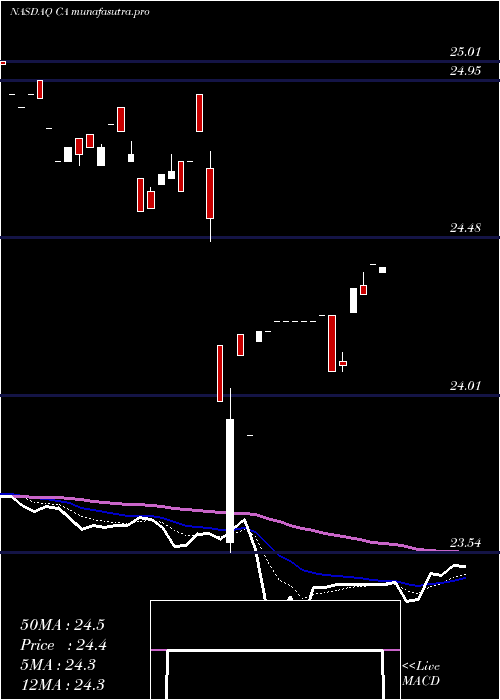
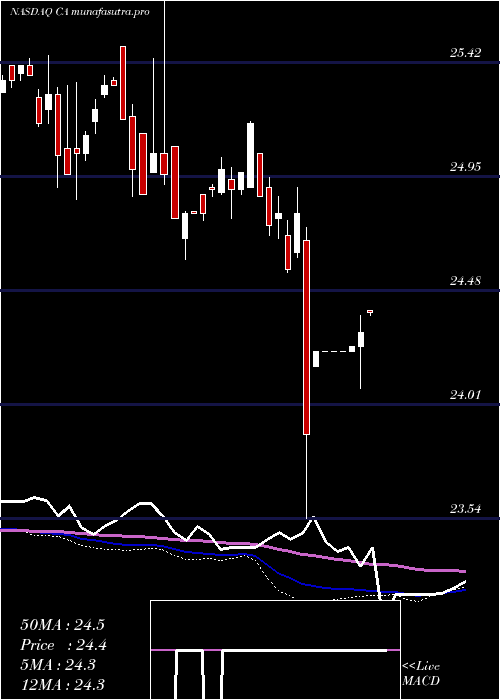
Daily price and charts and targets CaInc Strong Daily Stock price targets for CaInc CA are 25.12 and 25.18 | Daily Target 1 | 25.07 | | Daily Target 2 | 25.1 | | Daily Target 3 | 25.133333333333 | | Daily Target 4 | 25.16 | | Daily Target 5 | 25.19 |
Daily price and volume Ca Inc
| Date |
Closing |
Open |
Range |
Volume |
Tue 21 October 2025 |
25.12 (0.08%) |
25.11 |
25.11 - 25.17 |
5.1648 times |
Mon 20 October 2025 |
25.10 (0.32%) |
25.05 |
25.05 - 25.10 |
1.3736 times |
Fri 17 October 2025 |
25.02 (-0.12%) |
25.03 |
25.00 - 25.04 |
1.7033 times |
Thu 16 October 2025 |
25.05 (0.12%) |
25.05 |
25.05 - 25.05 |
0.0275 times |
Wed 15 October 2025 |
25.02 (0.12%) |
25.01 |
25.01 - 25.02 |
0.1648 times |
Tue 14 October 2025 |
24.99 (0.08%) |
24.99 |
24.99 - 24.99 |
0.0275 times |
Mon 13 October 2025 |
24.97 (0.12%) |
24.97 |
24.97 - 24.97 |
0.0275 times |
Fri 10 October 2025 |
24.94 (0.28%) |
24.98 |
24.91 - 24.99 |
0.6868 times |
Thu 09 October 2025 |
24.87 (0%) |
24.92 |
24.87 - 24.92 |
0.3846 times |
Wed 08 October 2025 |
24.87 (0%) |
24.92 |
24.87 - 24.92 |
0.4396 times |
Tue 07 October 2025 |
24.87 (0.2%) |
24.87 |
24.87 - 24.87 |
0.0275 times |
Weekly price and charts CaInc Strong weekly Stock price targets for CaInc CA are 25.09 and 25.21 | Weekly Target 1 | 24.99 | | Weekly Target 2 | 25.06 | | Weekly Target 3 | 25.113333333333 | | Weekly Target 4 | 25.18 | | Weekly Target 5 | 25.23 |
Weekly price and volumes for Ca Inc
| Date |
Closing |
Open |
Range |
Volume |
Tue 21 October 2025 |
25.12 (0.4%) |
25.05 |
25.05 - 25.17 |
1.8889 times |
Fri 17 October 2025 |
25.02 (0.32%) |
24.97 |
24.97 - 25.05 |
0.5635 times |
Fri 10 October 2025 |
24.94 (0.44%) |
24.83 |
24.81 - 24.99 |
0.7937 times |
Fri 03 October 2025 |
24.83 (0%) |
24.91 |
24.83 - 24.91 |
3.0794 times |
Fri 26 September 2025 |
24.83 (-0.32%) |
24.95 |
24.83 - 24.95 |
0.3016 times |
Fri 19 September 2025 |
24.91 (0.4%) |
24.90 |
24.85 - 25.01 |
0.9048 times |
Fri 12 September 2025 |
24.81 (1.51%) |
24.57 |
24.56 - 24.85 |
0.1032 times |
Fri 05 September 2025 |
24.44 (0.66%) |
24.23 |
24.20 - 24.48 |
1.8889 times |
Fri 29 August 2025 |
24.28 (-0.04%) |
24.23 |
24.23 - 24.32 |
0.0952 times |
Fri 29 August 2025 |
24.29 (0.16%) |
24.21 |
24.21 - 24.32 |
0.381 times |
Fri 22 August 2025 |
24.25 (0.12%) |
24.24 |
24.20 - 24.26 |
0.7698 times |
Monthly price and charts CaInc Strong monthly Stock price targets for CaInc CA are 24.97 and 25.33 | Monthly Target 1 | 24.67 | | Monthly Target 2 | 24.9 | | Monthly Target 3 | 25.033333333333 | | Monthly Target 4 | 25.26 | | Monthly Target 5 | 25.39 |
Monthly price and volumes Ca Inc
| Date |
Closing |
Open |
Range |
Volume |
Tue 21 October 2025 |
25.12 (0.84%) |
24.85 |
24.81 - 25.17 |
0.7311 times |
Tue 30 September 2025 |
24.91 (2.59%) |
24.23 |
24.20 - 25.01 |
0.4545 times |
Fri 29 August 2025 |
24.28 (0.71%) |
24.19 |
24.15 - 24.32 |
0.3646 times |
Thu 31 July 2025 |
24.11 (-0.99%) |
24.27 |
23.99 - 24.30 |
0.2923 times |
Mon 30 June 2025 |
24.35 (0.29%) |
24.15 |
24.07 - 24.35 |
0.7469 times |
Fri 30 May 2025 |
24.28 (0%) |
24.38 |
24.16 - 24.46 |
3.9972 times |
Wed 30 April 2025 |
24.28 (-1.58%) |
24.66 |
23.54 - 24.91 |
0.9019 times |
Mon 31 March 2025 |
24.67 (-1.99%) |
25.05 |
24.56 - 25.05 |
0.3737 times |
Fri 28 February 2025 |
25.17 (1.08%) |
24.89 |
24.78 - 25.18 |
0.6451 times |
Fri 31 January 2025 |
24.90 (-0.44%) |
25.12 |
24.61 - 25.85 |
1.4927 times |
Tue 31 December 2024 |
25.01 (-1.26%) |
25.49 |
24.87 - 25.49 |
1.0785 times |

DMA SMA EMA moving averages of Ca Inc CA
DMA (daily moving average) of Ca Inc CA
| DMA period | DMA value | | 5 day DMA | 25.06 | | 12 day DMA | 24.97 | | 20 day DMA | 24.93 | | 35 day DMA | 24.84 | | 50 day DMA | 24.66 | | 100 day DMA | 24.42 | | 150 day DMA | 24.4 | | 200 day DMA | 24.52 | EMA (exponential moving average) of Ca Inc CA
| EMA period | EMA current | EMA prev | EMA prev2 | | 5 day EMA | 25.07 | 25.04 | 25.01 | | 12 day EMA | 24.99 | 24.97 | 24.95 | | 20 day EMA | 24.94 | 24.92 | 24.9 | | 35 day EMA | 24.8 | 24.78 | 24.76 | | 50 day EMA | 24.67 | 24.65 | 24.63 |
SMA (simple moving average) of Ca Inc CA
| SMA period | SMA current | SMA prev | SMA prev2 | | 5 day SMA | 25.06 | 25.04 | 25.01 | | 12 day SMA | 24.97 | 24.95 | 24.93 | | 20 day SMA | 24.93 | 24.92 | 24.91 | | 35 day SMA | 24.84 | 24.81 | 24.79 | | 50 day SMA | 24.66 | 24.64 | 24.62 | | 100 day SMA | 24.42 | 24.41 | 24.4 | | 150 day SMA | 24.4 | 24.4 | 24.4 | | 200 day SMA | 24.52 | 24.52 | 24.52 |
|
|
