BaozunInc BZUN full analysis,charts,indicators,moving averages,SMA,DMA,EMA,ADX,MACD,RSIBaozun Inc BZUN WideScreen charts, DMA,SMA,EMA technical analysis, forecast prediction, by indicators ADX,MACD,RSI,CCI NASDAQ stock exchange
operates under Consumer Services sector & deals in Catalog Specialty Distribution
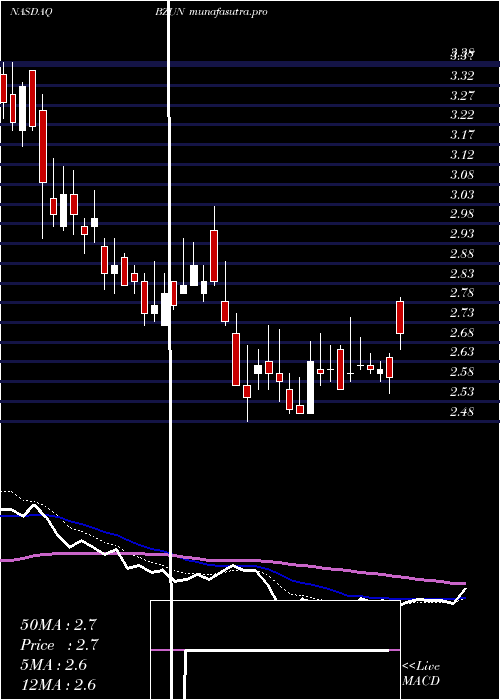
Daily price and charts and targets BaozunInc Strong Daily Stock price targets for BaozunInc BZUN are 2.54 and 2.67 | Daily Target 1 | 2.51 | | Daily Target 2 | 2.57 | | Daily Target 3 | 2.64 | | Daily Target 4 | 2.7 | | Daily Target 5 | 2.77 |
Daily price and volume Baozun Inc
| Date |
Closing |
Open |
Range |
Volume |
Fri 01 August 2025 |
2.63 (-2.95%) |
2.70 |
2.58 - 2.71 |
0.6974 times |
Thu 31 July 2025 |
2.71 (-4.24%) |
2.81 |
2.70 - 2.85 |
0.9779 times |
Wed 30 July 2025 |
2.83 (1.07%) |
2.80 |
2.76 - 3.04 |
1.9012 times |
Tue 29 July 2025 |
2.80 (0.72%) |
2.78 |
2.78 - 2.97 |
0.7196 times |
Mon 28 July 2025 |
2.78 (-0.71%) |
2.79 |
2.75 - 2.82 |
0.412 times |
Fri 25 July 2025 |
2.80 (-0.71%) |
2.80 |
2.75 - 2.85 |
0.4897 times |
Thu 24 July 2025 |
2.82 (-5.69%) |
2.98 |
2.79 - 3.00 |
1.6588 times |
Wed 23 July 2025 |
2.99 (0.67%) |
2.97 |
2.96 - 3.05 |
0.665 times |
Tue 22 July 2025 |
2.97 (-3.26%) |
3.07 |
2.90 - 3.08 |
1.8345 times |
Mon 21 July 2025 |
3.07 (-0.65%) |
3.10 |
3.05 - 3.19 |
0.6439 times |
Fri 18 July 2025 |
3.09 (-0.32%) |
3.14 |
3.08 - 3.22 |
1.1017 times |
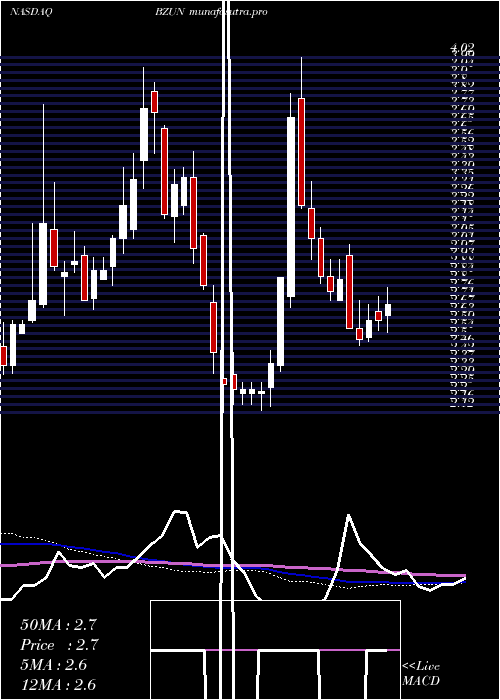
Weekly price and charts BaozunInc Strong weekly Stock price targets for BaozunInc BZUN are 2.38 and 2.84 | Weekly Target 1 | 2.29 | | Weekly Target 2 | 2.46 | | Weekly Target 3 | 2.75 | | Weekly Target 4 | 2.92 | | Weekly Target 5 | 3.21 |
Weekly price and volumes for Baozun Inc
| Date |
Closing |
Open |
Range |
Volume |
Fri 01 August 2025 |
2.63 (-6.07%) |
2.79 |
2.58 - 3.04 |
1.242 times |
Fri 25 July 2025 |
2.80 (-9.39%) |
3.10 |
2.75 - 3.19 |
1.396 times |
Fri 18 July 2025 |
3.09 (18.39%) |
2.64 |
2.55 - 3.22 |
1.9571 times |
Fri 11 July 2025 |
2.61 (0%) |
2.66 |
2.56 - 2.74 |
0.6495 times |
Thu 03 July 2025 |
2.61 (3.98%) |
2.52 |
2.50 - 2.70 |
0.7004 times |
Fri 27 June 2025 |
2.51 (-2.33%) |
2.57 |
2.48 - 2.72 |
1.1436 times |
Fri 20 June 2025 |
2.57 (-9.19%) |
2.96 |
2.57 - 3.02 |
0.9539 times |
Fri 13 June 2025 |
2.83 (2.17%) |
2.72 |
2.72 - 2.94 |
0.5933 times |
Fri 06 June 2025 |
2.77 (-2.81%) |
2.85 |
2.72 - 2.94 |
0.6483 times |
Fri 30 May 2025 |
2.85 (-6.56%) |
3.05 |
2.81 - 3.11 |
0.716 times |
Fri 23 May 2025 |
3.05 (-5.57%) |
3.21 |
2.94 - 3.36 |
0.8929 times |
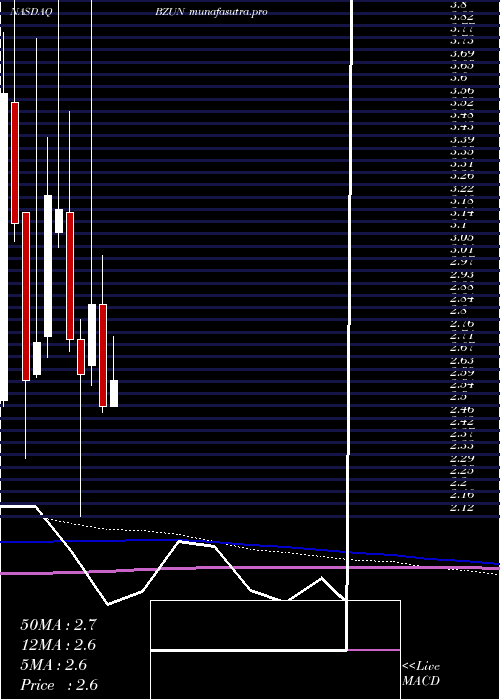
Monthly price and charts BaozunInc Strong monthly Stock price targets for BaozunInc BZUN are 2.54 and 2.67 | Monthly Target 1 | 2.51 | | Monthly Target 2 | 2.57 | | Monthly Target 3 | 2.64 | | Monthly Target 4 | 2.7 | | Monthly Target 5 | 2.77 |
Monthly price and volumes Baozun Inc
| Date |
Closing |
Open |
Range |
Volume |
Fri 01 August 2025 |
2.63 (-2.95%) |
2.70 |
2.58 - 2.71 |
0.0315 times |
Thu 31 July 2025 |
2.71 (8.4%) |
2.50 |
2.50 - 3.22 |
0.9309 times |
Mon 30 June 2025 |
2.50 (-12.28%) |
2.85 |
2.48 - 3.02 |
0.6278 times |
Fri 30 May 2025 |
2.85 (9.2%) |
2.64 |
2.57 - 4.02 |
1.14 times |
Wed 30 April 2025 |
2.61 (-4.4%) |
2.73 |
2.12 - 2.80 |
1.0196 times |
Mon 31 March 2025 |
2.73 (-14.15%) |
3.17 |
2.69 - 3.52 |
0.6673 times |
Fri 28 February 2025 |
3.18 (-1.55%) |
3.10 |
3.05 - 3.97 |
1.1354 times |
Fri 31 January 2025 |
3.23 (18.75%) |
2.74 |
2.67 - 3.43 |
1.1949 times |
Tue 31 December 2024 |
2.72 (5.02%) |
2.61 |
2.60 - 3.77 |
2.2478 times |
Tue 26 November 2024 |
2.59 (-17.25%) |
3.17 |
2.32 - 3.17 |
1.0048 times |
Thu 31 October 2024 |
3.13 (-12.57%) |
3.55 |
3.07 - 4.38 |
2.482 times |
DMA SMA EMA moving averages of Baozun Inc BZUN
DMA (daily moving average) of Baozun Inc BZUN
| DMA period | DMA value | | 5 day DMA | 2.75 | | 12 day DMA | 2.88 | | 20 day DMA | 2.79 | | 35 day DMA | 2.73 | | 50 day DMA | 2.79 | | 100 day DMA | 2.81 | | 150 day DMA | 2.92 | | 200 day DMA | 2.95 | EMA (exponential moving average) of Baozun Inc BZUN
| EMA period | EMA current | EMA prev | EMA prev2 | | 5 day EMA | 2.74 | 2.79 | 2.83 | | 12 day EMA | 2.78 | 2.81 | 2.83 | | 20 day EMA | 2.8 | 2.82 | 2.83 | | 35 day EMA | 2.84 | 2.85 | 2.86 | | 50 day EMA | 2.83 | 2.84 | 2.85 |
SMA (simple moving average) of Baozun Inc BZUN
| SMA period | SMA current | SMA prev | SMA prev2 | | 5 day SMA | 2.75 | 2.78 | 2.81 | | 12 day SMA | 2.88 | 2.91 | 2.91 | | 20 day SMA | 2.79 | 2.79 | 2.78 | | 35 day SMA | 2.73 | 2.74 | 2.74 | | 50 day SMA | 2.79 | 2.8 | 2.81 | | 100 day SMA | 2.81 | 2.82 | 2.82 | | 150 day SMA | 2.92 | 2.93 | 2.93 | | 200 day SMA | 2.95 | 2.96 | 2.96 |
|
|
