BridgewaterBancshares BWB full analysis,charts,indicators,moving averages,SMA,DMA,EMA,ADX,MACD,RSIBridgewater Bancshares BWB WideScreen charts, DMA,SMA,EMA technical analysis, forecast prediction, by indicators ADX,MACD,RSI,CCI NASDAQ stock exchange
operates under Finance sector & deals in Major Banks
Daily price and charts and targets BridgewaterBancshares Strong Daily Stock price targets for BridgewaterBancshares BWB are 16.08 and 16.49 | Daily Target 1 | 16 | | Daily Target 2 | 16.16 | | Daily Target 3 | 16.413333333333 | | Daily Target 4 | 16.57 | | Daily Target 5 | 16.82 |
Daily price and volume Bridgewater Bancshares
| Date |
Closing |
Open |
Range |
Volume |
Fri 11 July 2025 |
16.31 (-2.22%) |
16.67 |
16.26 - 16.67 |
0.3606 times |
Thu 10 July 2025 |
16.68 (0%) |
16.54 |
16.54 - 16.85 |
0.2831 times |
Wed 09 July 2025 |
16.68 (0.48%) |
16.89 |
16.48 - 16.91 |
0.5056 times |
Tue 08 July 2025 |
16.60 (0.24%) |
16.64 |
16.44 - 16.87 |
0.6463 times |
Mon 07 July 2025 |
16.56 (-2.59%) |
16.89 |
16.50 - 17.05 |
0.7053 times |
Thu 03 July 2025 |
17.00 (1.49%) |
16.88 |
16.76 - 17.29 |
0.4811 times |
Wed 02 July 2025 |
16.75 (3.2%) |
16.32 |
16.19 - 16.80 |
1.0794 times |
Tue 01 July 2025 |
16.23 (2.01%) |
15.82 |
15.68 - 16.50 |
0.6783 times |
Mon 30 June 2025 |
15.91 (-1.18%) |
16.11 |
15.89 - 16.32 |
0.9681 times |
Fri 27 June 2025 |
16.10 (-0.56%) |
16.27 |
15.89 - 16.33 |
4.2922 times |
Thu 26 June 2025 |
16.19 (1.76%) |
16.09 |
15.92 - 17.66 |
0.5022 times |
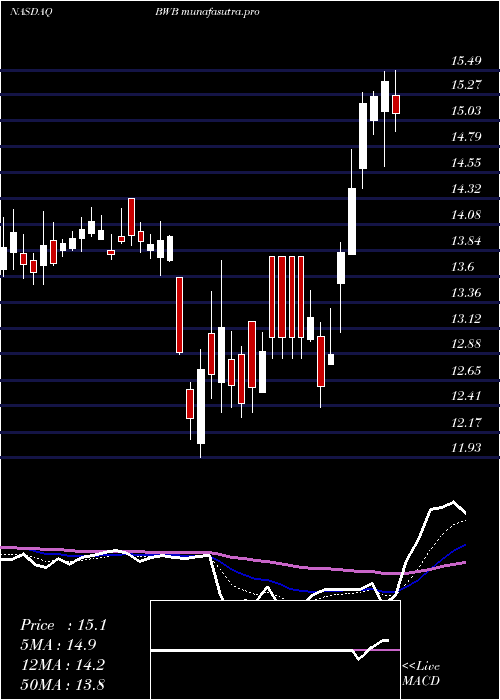
Weekly price and charts BridgewaterBancshares Strong weekly Stock price targets for BridgewaterBancshares BWB are 15.89 and 16.68 | Weekly Target 1 | 15.75 | | Weekly Target 2 | 16.03 | | Weekly Target 3 | 16.54 | | Weekly Target 4 | 16.82 | | Weekly Target 5 | 17.33 |
Weekly price and volumes for Bridgewater Bancshares
| Date |
Closing |
Open |
Range |
Volume |
Fri 11 July 2025 |
16.31 (-4.06%) |
16.89 |
16.26 - 17.05 |
0.8211 times |
Thu 03 July 2025 |
17.00 (5.59%) |
16.11 |
15.68 - 17.29 |
1.0529 times |
Fri 27 June 2025 |
16.10 (7.19%) |
14.98 |
14.98 - 17.66 |
2.2688 times |
Fri 20 June 2025 |
15.02 (1.14%) |
14.89 |
14.80 - 15.15 |
0.685 times |
Fri 13 June 2025 |
14.85 (-0.87%) |
15.11 |
14.79 - 15.35 |
0.6977 times |
Fri 06 June 2025 |
14.98 (2.32%) |
14.57 |
14.35 - 15.02 |
0.8811 times |
Fri 30 May 2025 |
14.64 (-0.41%) |
14.83 |
14.51 - 16.34 |
0.6429 times |
Fri 23 May 2025 |
14.70 (-6.31%) |
15.50 |
14.45 - 15.75 |
0.7743 times |
Fri 16 May 2025 |
15.69 (1.16%) |
15.90 |
15.45 - 16.15 |
1.4098 times |
Fri 09 May 2025 |
15.51 (-1.4%) |
15.50 |
15.00 - 15.98 |
0.7663 times |
Fri 02 May 2025 |
15.73 (9.24%) |
14.59 |
14.40 - 15.77 |
1.4388 times |
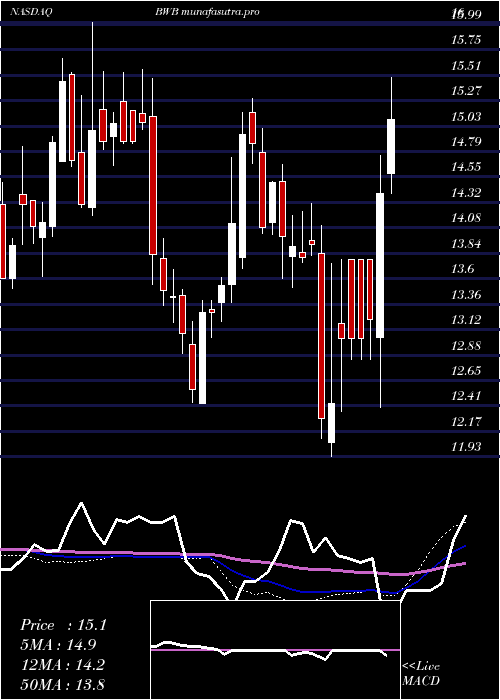
Monthly price and charts BridgewaterBancshares Strong monthly Stock price targets for BridgewaterBancshares BWB are 16 and 17.61 | Monthly Target 1 | 14.82 | | Monthly Target 2 | 15.56 | | Monthly Target 3 | 16.426666666667 | | Monthly Target 4 | 17.17 | | Monthly Target 5 | 18.04 |
Monthly price and volumes Bridgewater Bancshares
| Date |
Closing |
Open |
Range |
Volume |
Fri 11 July 2025 |
16.31 (2.51%) |
15.82 |
15.68 - 17.29 |
0.4476 times |
Mon 30 June 2025 |
15.91 (8.67%) |
14.57 |
14.35 - 17.66 |
1.3952 times |
Fri 30 May 2025 |
14.64 (-4.87%) |
15.26 |
14.45 - 16.34 |
1.1603 times |
Wed 30 April 2025 |
15.39 (10.8%) |
13.77 |
11.93 - 15.48 |
1.7263 times |
Mon 31 March 2025 |
13.89 (-4.21%) |
14.51 |
13.52 - 14.67 |
0.6118 times |
Fri 28 February 2025 |
14.50 (2.69%) |
13.80 |
13.70 - 15.29 |
0.8206 times |
Fri 31 January 2025 |
14.12 (4.52%) |
13.69 |
12.43 - 14.74 |
1.0645 times |
Tue 31 December 2024 |
13.51 (-9.27%) |
15.15 |
13.33 - 15.56 |
0.8323 times |
Tue 26 November 2024 |
14.89 (1.99%) |
14.74 |
14.19 - 16.00 |
1.2554 times |
Thu 31 October 2024 |
14.60 (3.03%) |
14.20 |
13.62 - 15.67 |
0.6859 times |
Mon 30 September 2024 |
14.17 (-1.73%) |
14.30 |
13.51 - 14.84 |
0.7758 times |

DMA SMA EMA moving averages of Bridgewater Bancshares BWB
DMA (daily moving average) of Bridgewater Bancshares BWB
| DMA period | DMA value | | 5 day DMA | 16.57 | | 12 day DMA | 16.41 | | 20 day DMA | 15.92 | | 35 day DMA | 15.46 | | 50 day DMA | 15.51 | | 100 day DMA | 14.6 | | 150 day DMA | 14.41 | | 200 day DMA | 14.47 | EMA (exponential moving average) of Bridgewater Bancshares BWB
| EMA period | EMA current | EMA prev | EMA prev2 | | 5 day EMA | 16.52 | 16.62 | 16.59 | | 12 day EMA | 16.33 | 16.33 | 16.27 | | 20 day EMA | 16.07 | 16.04 | 15.97 | | 35 day EMA | 15.78 | 15.75 | 15.69 | | 50 day EMA | 15.46 | 15.43 | 15.38 |
SMA (simple moving average) of Bridgewater Bancshares BWB
| SMA period | SMA current | SMA prev | SMA prev2 | | 5 day SMA | 16.57 | 16.7 | 16.72 | | 12 day SMA | 16.41 | 16.37 | 16.27 | | 20 day SMA | 15.92 | 15.87 | 15.8 | | 35 day SMA | 15.46 | 15.44 | 15.41 | | 50 day SMA | 15.51 | 15.49 | 15.44 | | 100 day SMA | 14.6 | 14.58 | 14.56 | | 150 day SMA | 14.41 | 14.4 | 14.39 | | 200 day SMA | 14.47 | 14.46 | 14.44 |
|
|
