SierraBancorp BSRR full analysis,charts,indicators,moving averages,SMA,DMA,EMA,ADX,MACD,RSISierra Bancorp BSRR WideScreen charts, DMA,SMA,EMA technical analysis, forecast prediction, by indicators ADX,MACD,RSI,CCI NASDAQ stock exchange
operates under Finance sector & deals in Major Banks
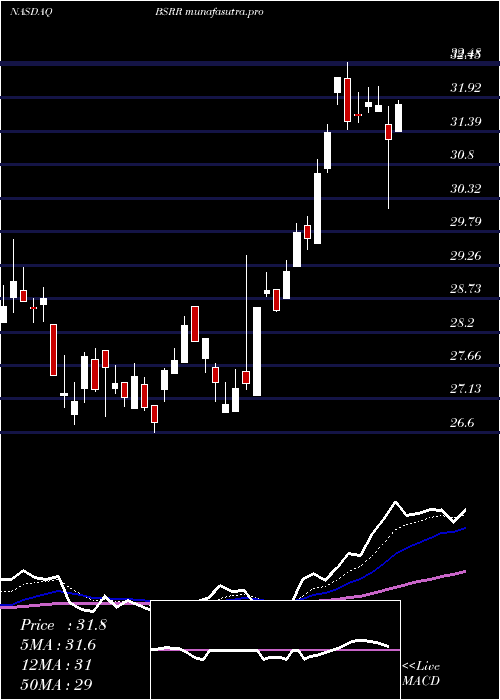
Daily price and charts and targets SierraBancorp Strong Daily Stock price targets for SierraBancorp BSRR are 29.14 and 30.23 | Daily Target 1 | 28.35 | | Daily Target 2 | 28.84 | | Daily Target 3 | 29.443333333333 | | Daily Target 4 | 29.93 | | Daily Target 5 | 30.53 |
Daily price and volume Sierra Bancorp
| Date |
Closing |
Open |
Range |
Volume |
Thu 31 July 2025 |
29.32 (-0.24%) |
29.04 |
28.96 - 30.05 |
1.0722 times |
Wed 30 July 2025 |
29.39 (-2.62%) |
30.12 |
29.28 - 30.41 |
0.7196 times |
Tue 29 July 2025 |
30.18 (-2.14%) |
31.18 |
30.04 - 31.18 |
0.9498 times |
Mon 28 July 2025 |
30.84 (1.11%) |
30.74 |
30.24 - 30.97 |
0.8779 times |
Fri 25 July 2025 |
30.50 (-0.68%) |
30.73 |
30.03 - 31.32 |
0.5325 times |
Thu 24 July 2025 |
30.71 (-2.63%) |
31.12 |
30.52 - 31.24 |
0.5829 times |
Wed 23 July 2025 |
31.54 (3%) |
30.98 |
30.38 - 31.60 |
1.0386 times |
Tue 22 July 2025 |
30.62 (-0.39%) |
30.57 |
30.18 - 31.06 |
1.5423 times |
Mon 21 July 2025 |
30.74 (-0.52%) |
30.96 |
30.66 - 31.46 |
1.6454 times |
Fri 18 July 2025 |
30.90 (-1.5%) |
31.67 |
30.89 - 31.69 |
1.0388 times |
Thu 17 July 2025 |
31.37 (1.26%) |
30.85 |
30.85 - 31.58 |
0.8138 times |
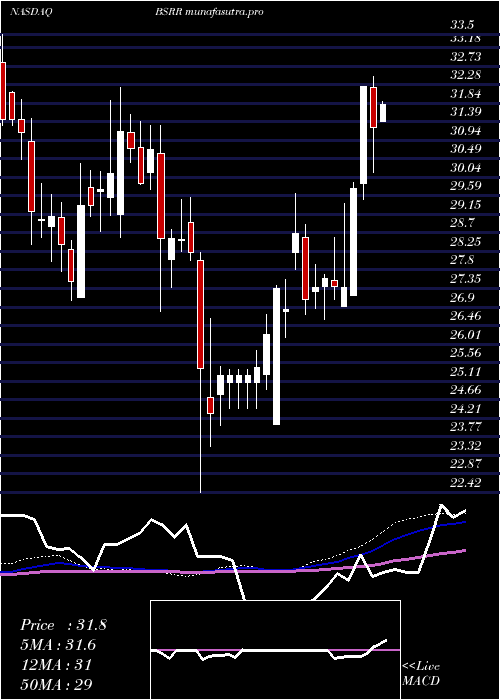
Weekly price and charts SierraBancorp Strong weekly Stock price targets for SierraBancorp BSRR are 28.03 and 30.25 | Weekly Target 1 | 27.6 | | Weekly Target 2 | 28.46 | | Weekly Target 3 | 29.82 | | Weekly Target 4 | 30.68 | | Weekly Target 5 | 32.04 |
Weekly price and volumes for Sierra Bancorp
| Date |
Closing |
Open |
Range |
Volume |
Thu 31 July 2025 |
29.32 (-3.87%) |
30.74 |
28.96 - 31.18 |
1.0152 times |
Fri 25 July 2025 |
30.50 (-1.29%) |
30.96 |
30.03 - 31.60 |
1.4983 times |
Fri 18 July 2025 |
30.90 (-1.15%) |
31.39 |
30.57 - 31.88 |
1.1023 times |
Fri 11 July 2025 |
31.26 (-3.04%) |
32.22 |
30.16 - 32.48 |
1.129 times |
Thu 03 July 2025 |
32.24 (8.26%) |
29.89 |
29.51 - 32.24 |
0.7724 times |
Fri 27 June 2025 |
29.78 (8.81%) |
27.19 |
27.19 - 29.92 |
1.139 times |
Fri 20 June 2025 |
27.37 (-0.07%) |
26.92 |
26.92 - 29.42 |
0.7259 times |
Fri 13 June 2025 |
27.39 (-0.72%) |
27.54 |
27.09 - 28.60 |
1.1041 times |
Fri 06 June 2025 |
27.59 (0.8%) |
27.39 |
26.60 - 27.70 |
0.7872 times |
Fri 30 May 2025 |
27.37 (1.03%) |
27.29 |
26.86 - 27.93 |
0.7266 times |
Fri 23 May 2025 |
27.09 (-5.54%) |
28.59 |
26.73 - 28.91 |
1.0751 times |
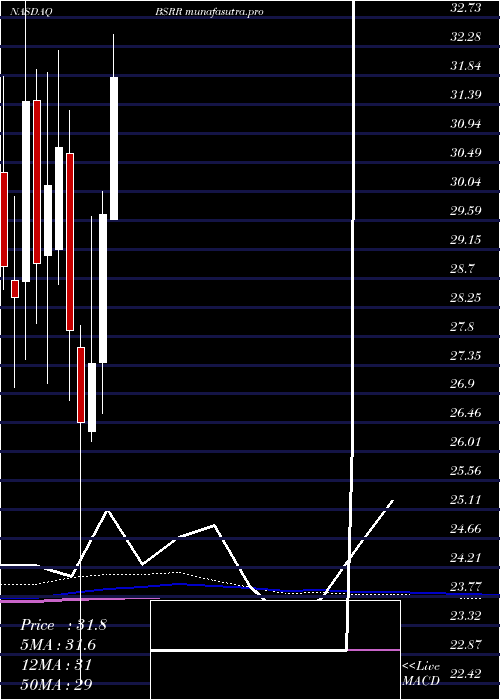
Monthly price and charts SierraBancorp Strong monthly Stock price targets for SierraBancorp BSRR are 27.38 and 30.9 | Monthly Target 1 | 26.73 | | Monthly Target 2 | 28.03 | | Monthly Target 3 | 30.253333333333 | | Monthly Target 4 | 31.55 | | Monthly Target 5 | 33.77 |
Monthly price and volumes Sierra Bancorp
| Date |
Closing |
Open |
Range |
Volume |
Thu 31 July 2025 |
29.32 (-1.25%) |
29.61 |
28.96 - 32.48 |
0.9979 times |
Mon 30 June 2025 |
29.69 (8.48%) |
27.39 |
26.60 - 30.04 |
0.7613 times |
Fri 30 May 2025 |
27.37 (3.44%) |
26.32 |
26.16 - 29.66 |
0.8179 times |
Wed 30 April 2025 |
26.46 (-5.09%) |
27.63 |
22.42 - 27.96 |
1.0555 times |
Mon 31 March 2025 |
27.88 (-9.24%) |
30.63 |
26.80 - 31.29 |
1.0266 times |
Fri 28 February 2025 |
30.72 (1.92%) |
29.15 |
28.60 - 32.22 |
1.0971 times |
Fri 31 January 2025 |
30.14 (4.22%) |
29.05 |
27.06 - 31.89 |
1.3184 times |
Tue 31 December 2024 |
28.92 (-8.02%) |
31.45 |
28.00 - 31.93 |
0.8975 times |
Tue 26 November 2024 |
31.44 (10.7%) |
28.64 |
27.43 - 35.13 |
1.1946 times |
Thu 31 October 2024 |
28.40 (-1.66%) |
28.67 |
27.00 - 29.96 |
0.8332 times |
Mon 30 September 2024 |
28.88 (-4.15%) |
29.69 |
26.80 - 31.83 |
0.9216 times |
DMA SMA EMA moving averages of Sierra Bancorp BSRR
DMA (daily moving average) of Sierra Bancorp BSRR
| DMA period | DMA value | | 5 day DMA | 30.05 | | 12 day DMA | 30.59 | | 20 day DMA | 30.99 | | 35 day DMA | 30 | | 50 day DMA | 29.26 | | 100 day DMA | 28.12 | | 150 day DMA | 28.69 | | 200 day DMA | 29.02 | EMA (exponential moving average) of Sierra Bancorp BSRR
| EMA period | EMA current | EMA prev | EMA prev2 | | 5 day EMA | 29.91 | 30.2 | 30.61 | | 12 day EMA | 30.36 | 30.55 | 30.76 | | 20 day EMA | 30.38 | 30.49 | 30.61 | | 35 day EMA | 29.95 | 29.99 | 30.03 | | 50 day EMA | 29.28 | 29.28 | 29.28 |
SMA (simple moving average) of Sierra Bancorp BSRR
| SMA period | SMA current | SMA prev | SMA prev2 | | 5 day SMA | 30.05 | 30.32 | 30.75 | | 12 day SMA | 30.59 | 30.7 | 30.9 | | 20 day SMA | 30.99 | 31.1 | 31.16 | | 35 day SMA | 30 | 29.96 | 29.91 | | 50 day SMA | 29.26 | 29.25 | 29.24 | | 100 day SMA | 28.12 | 28.11 | 28.1 | | 150 day SMA | 28.69 | 28.7 | 28.69 | | 200 day SMA | 29.02 | 29.01 | 29 |
|
|
