BiontechSe BNTX full analysis,charts,indicators,moving averages,SMA,DMA,EMA,ADX,MACD,RSIBiontech Se BNTX WideScreen charts, DMA,SMA,EMA technical analysis, forecast prediction, by indicators ADX,MACD,RSI,CCI NASDAQ stock exchange
Daily price and charts and targets BiontechSe Strong Daily Stock price targets for BiontechSe BNTX are 94.99 and 96.47 | Daily Target 1 | 94.57 | | Daily Target 2 | 95.41 | | Daily Target 3 | 96.05 | | Daily Target 4 | 96.89 | | Daily Target 5 | 97.53 |
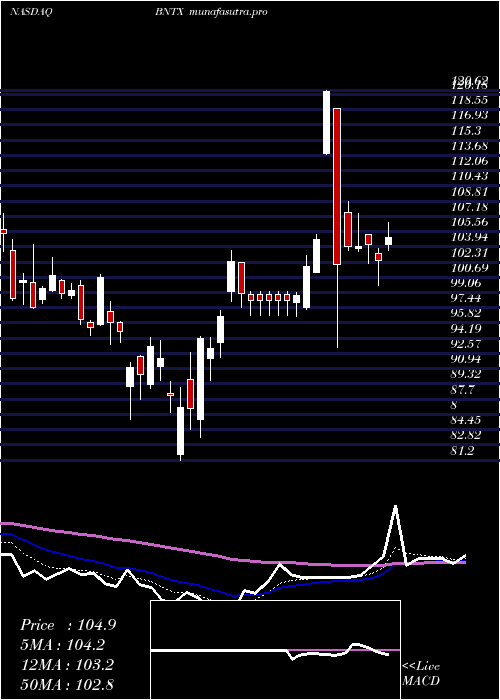
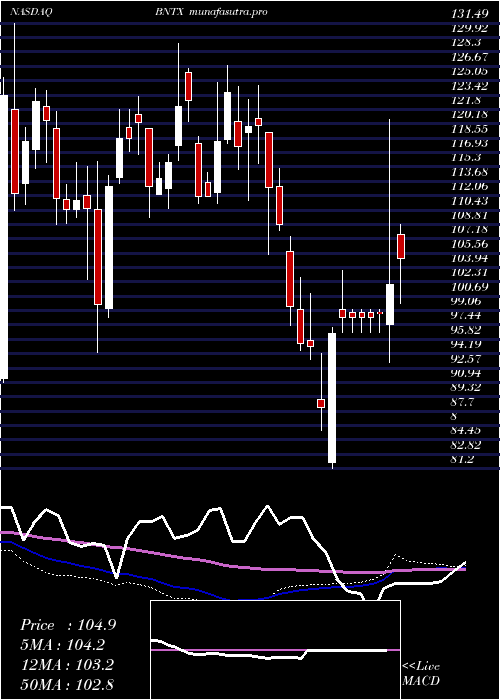
Daily price and volume Biontech Se
| Date |
Closing |
Open |
Range |
Volume |
Fri 05 December 2025 |
96.25 (0.26%) |
96.41 |
95.21 - 96.69 |
0.8156 times |
Thu 04 December 2025 |
96.00 (-0.75%) |
97.08 |
95.59 - 98.11 |
1.0334 times |
Wed 03 December 2025 |
96.73 (0.7%) |
96.56 |
96.20 - 98.20 |
2.2367 times |
Tue 02 December 2025 |
96.06 (-1.37%) |
97.81 |
95.61 - 98.82 |
1.0239 times |
Mon 01 December 2025 |
97.39 (-5.58%) |
101.00 |
97.15 - 101.84 |
1.1306 times |
Fri 28 November 2025 |
103.15 (0.44%) |
102.30 |
102.10 - 104.05 |
0.5279 times |
Wed 26 November 2025 |
102.70 (3%) |
99.65 |
98.72 - 102.90 |
0.6718 times |
Tue 25 November 2025 |
99.71 (3.28%) |
96.70 |
96.65 - 99.81 |
0.7784 times |
Mon 24 November 2025 |
96.54 (0.99%) |
95.40 |
94.00 - 98.07 |
0.9375 times |
Fri 21 November 2025 |
95.59 (-1.42%) |
97.52 |
95.45 - 99.15 |
0.8442 times |
Thu 20 November 2025 |
96.97 (-4.4%) |
102.23 |
96.88 - 102.43 |
0.7574 times |
Weekly price and charts BiontechSe Strong weekly Stock price targets for BiontechSe BNTX are 92.42 and 99.05 | Weekly Target 1 | 91.14 | | Weekly Target 2 | 93.69 | | Weekly Target 3 | 97.766666666667 | | Weekly Target 4 | 100.32 | | Weekly Target 5 | 104.4 |
Weekly price and volumes for Biontech Se
| Date |
Closing |
Open |
Range |
Volume |
Fri 05 December 2025 |
96.25 (-6.69%) |
101.00 |
95.21 - 101.84 |
2.3879 times |
Fri 28 November 2025 |
103.15 (7.91%) |
95.40 |
94.00 - 104.05 |
1.1157 times |
Fri 21 November 2025 |
95.59 (-7.28%) |
103.24 |
95.45 - 103.91 |
1.1741 times |
Fri 14 November 2025 |
103.09 (-0.05%) |
104.32 |
101.52 - 113.39 |
1.6228 times |
Fri 07 November 2025 |
103.14 (-0.74%) |
104.38 |
100.09 - 105.21 |
0.5585 times |
Fri 31 October 2025 |
103.91 (0%) |
104.03 |
102.34 - 104.74 |
0.1371 times |
Fri 31 October 2025 |
103.91 (-1.66%) |
106.05 |
101.90 - 107.32 |
0.5777 times |
Fri 24 October 2025 |
105.66 (0.49%) |
104.07 |
103.06 - 108.05 |
0.8154 times |
Fri 17 October 2025 |
105.14 (3.02%) |
102.00 |
101.00 - 109.74 |
0.8095 times |
Fri 10 October 2025 |
102.06 (-3.25%) |
104.57 |
101.18 - 108.09 |
0.8013 times |
Fri 03 October 2025 |
105.49 (7.56%) |
98.35 |
96.08 - 106.52 |
0.818 times |
Monthly price and charts BiontechSe Strong monthly Stock price targets for BiontechSe BNTX are 92.42 and 99.05 | Monthly Target 1 | 91.14 | | Monthly Target 2 | 93.69 | | Monthly Target 3 | 97.766666666667 | | Monthly Target 4 | 100.32 | | Monthly Target 5 | 104.4 |
Monthly price and volumes Biontech Se
| Date |
Closing |
Open |
Range |
Volume |
Fri 05 December 2025 |
96.25 (-6.69%) |
101.00 |
95.21 - 101.84 |
0.5218 times |
Fri 28 November 2025 |
103.15 (-0.73%) |
104.38 |
94.00 - 113.39 |
0.9771 times |
Fri 31 October 2025 |
103.91 (5.36%) |
99.25 |
98.80 - 109.74 |
0.7924 times |
Tue 30 September 2025 |
98.62 (-1.38%) |
99.97 |
90.12 - 114.89 |
1.3874 times |
Fri 29 August 2025 |
100.00 (-6.98%) |
105.02 |
99.99 - 114.15 |
0.8388 times |
Thu 31 July 2025 |
107.50 (0.97%) |
107.13 |
105.35 - 115.54 |
0.7594 times |
Mon 30 June 2025 |
106.47 (11.13%) |
106.66 |
101.87 - 122.90 |
1.1771 times |
Fri 30 May 2025 |
95.81 (-8.01%) |
103.17 |
89.77 - 106.99 |
1.0166 times |
Wed 30 April 2025 |
104.15 (14.38%) |
92.27 |
81.20 - 120.62 |
1.5577 times |
Mon 31 March 2025 |
91.06 (-19.36%) |
113.11 |
85.55 - 115.10 |
0.9716 times |
Fri 28 February 2025 |
112.92 (-8.77%) |
120.44 |
105.45 - 124.49 |
0.7922 times |

DMA SMA EMA moving averages of Biontech Se BNTX
DMA (daily moving average) of Biontech Se BNTX
| DMA period | DMA value | | 5 day DMA | 96.49 | | 12 day DMA | 98.21 | | 20 day DMA | 100.96 | | 35 day DMA | 102.7 | | 50 day DMA | 102.77 | | 100 day DMA | 104.56 | | 150 day DMA | 104.36 | | 200 day DMA | 103.62 | EMA (exponential moving average) of Biontech Se BNTX
| EMA period | EMA current | EMA prev | EMA prev2 | | 5 day EMA | 96.96 | 97.32 | 97.98 | | 12 day EMA | 98.58 | 99 | 99.54 | | 20 day EMA | 99.85 | 100.23 | 100.68 | | 35 day EMA | 100.93 | 101.21 | 101.52 | | 50 day EMA | 101.77 | 102 | 102.24 |
SMA (simple moving average) of Biontech Se BNTX
| SMA period | SMA current | SMA prev | SMA prev2 | | 5 day SMA | 96.49 | 97.87 | 99.21 | | 12 day SMA | 98.21 | 98.73 | 99.29 | | 20 day SMA | 100.96 | 101.32 | 101.69 | | 35 day SMA | 102.7 | 102.95 | 103.19 | | 50 day SMA | 102.77 | 102.8 | 102.88 | | 100 day SMA | 104.56 | 104.72 | 104.87 | | 150 day SMA | 104.36 | 104.4 | 104.46 | | 200 day SMA | 103.62 | 103.73 | 103.85 |
|
|
