BrighthouseFinancial BHFAP full analysis,charts,indicators,moving averages,SMA,DMA,EMA,ADX,MACD,RSIBrighthouse Financial BHFAP WideScreen charts, DMA,SMA,EMA technical analysis, forecast prediction, by indicators ADX,MACD,RSI,CCI NASDAQ stock exchange
Daily price and charts and targets BrighthouseFinancial Strong Daily Stock price targets for BrighthouseFinancial BHFAP are 15.62 and 16.12 | Daily Target 1 | 15.48 | | Daily Target 2 | 15.75 | | Daily Target 3 | 15.976666666667 | | Daily Target 4 | 16.25 | | Daily Target 5 | 16.48 |
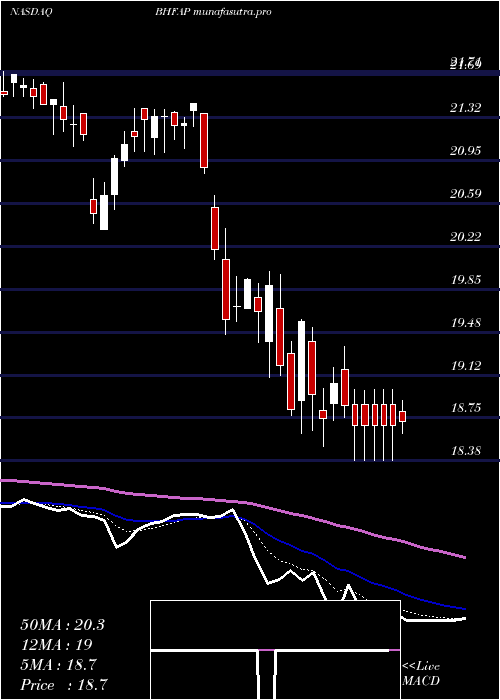
Daily price and volume Brighthouse Financial
| Date |
Closing |
Open |
Range |
Volume |
Fri 05 December 2025 |
16.03 (0.19%) |
16.04 |
15.70 - 16.20 |
1.3462 times |
Thu 04 December 2025 |
16.00 (-1.78%) |
16.32 |
15.98 - 16.52 |
1.3169 times |
Wed 03 December 2025 |
16.29 (0.12%) |
16.24 |
16.24 - 16.44 |
1.112 times |
Tue 02 December 2025 |
16.27 (-2.22%) |
16.55 |
16.17 - 16.79 |
0.9267 times |
Mon 01 December 2025 |
16.64 (0.91%) |
16.35 |
16.33 - 16.87 |
1.8297 times |
Fri 28 November 2025 |
16.49 (1.66%) |
16.38 |
16.20 - 16.49 |
0.5504 times |
Wed 26 November 2025 |
16.22 (0.56%) |
16.19 |
16.04 - 16.34 |
1.2249 times |
Tue 25 November 2025 |
16.13 (-0.06%) |
16.07 |
16.00 - 16.19 |
0.5491 times |
Mon 24 November 2025 |
16.14 (0.62%) |
16.10 |
16.04 - 16.18 |
0.6438 times |
Fri 21 November 2025 |
16.04 (2.75%) |
15.51 |
15.50 - 16.10 |
0.5003 times |
Thu 20 November 2025 |
15.61 (-1.08%) |
15.86 |
15.57 - 15.86 |
1.4702 times |
Weekly price and charts BrighthouseFinancial Strong weekly Stock price targets for BrighthouseFinancial BHFAP are 15.28 and 16.45 | Weekly Target 1 | 15.03 | | Weekly Target 2 | 15.53 | | Weekly Target 3 | 16.2 | | Weekly Target 4 | 16.7 | | Weekly Target 5 | 17.37 |
Weekly price and volumes for Brighthouse Financial
| Date |
Closing |
Open |
Range |
Volume |
Fri 05 December 2025 |
16.03 (-2.79%) |
16.35 |
15.70 - 16.87 |
0.9788 times |
Fri 28 November 2025 |
16.49 (2.81%) |
16.10 |
16.00 - 16.49 |
0.4448 times |
Fri 21 November 2025 |
16.04 (-0.19%) |
16.13 |
15.50 - 16.23 |
0.7021 times |
Fri 14 November 2025 |
16.07 (-5.53%) |
16.91 |
16.00 - 17.19 |
1.2262 times |
Fri 07 November 2025 |
17.01 (11.03%) |
15.48 |
15.27 - 17.95 |
1.3668 times |
Fri 31 October 2025 |
15.32 (0%) |
15.63 |
15.14 - 15.85 |
0.3224 times |
Fri 31 October 2025 |
15.32 (-2.3%) |
15.66 |
15.14 - 16.37 |
0.9784 times |
Fri 24 October 2025 |
15.68 (-3.27%) |
16.11 |
15.28 - 16.58 |
2.204 times |
Fri 17 October 2025 |
16.21 (6.64%) |
15.15 |
15.01 - 16.57 |
1.0819 times |
Fri 10 October 2025 |
15.20 (-4.76%) |
15.91 |
15.06 - 16.29 |
0.6946 times |
Fri 03 October 2025 |
15.96 (-4.6%) |
16.65 |
15.91 - 16.97 |
0.5106 times |

Monthly price and charts BrighthouseFinancial Strong monthly Stock price targets for BrighthouseFinancial BHFAP are 15.28 and 16.45 | Monthly Target 1 | 15.03 | | Monthly Target 2 | 15.53 | | Monthly Target 3 | 16.2 | | Monthly Target 4 | 16.7 | | Monthly Target 5 | 17.37 |
Monthly price and volumes Brighthouse Financial
| Date |
Closing |
Open |
Range |
Volume |
Fri 05 December 2025 |
16.03 (-2.79%) |
16.35 |
15.70 - 16.87 |
0.3134 times |
Fri 28 November 2025 |
16.49 (7.64%) |
15.48 |
15.27 - 17.95 |
1.1976 times |
Fri 31 October 2025 |
15.32 (-7.21%) |
16.51 |
15.01 - 16.67 |
1.7675 times |
Tue 30 September 2025 |
16.51 (-8.78%) |
18.07 |
15.80 - 18.70 |
1.253 times |
Fri 29 August 2025 |
18.10 (9.43%) |
16.37 |
15.50 - 18.49 |
0.7054 times |
Thu 31 July 2025 |
16.54 (-10.06%) |
18.78 |
14.02 - 19.18 |
2.5371 times |
Mon 30 June 2025 |
18.39 (-10.99%) |
20.59 |
18.30 - 21.40 |
0.5753 times |
Fri 30 May 2025 |
20.66 (3.15%) |
19.91 |
18.90 - 20.93 |
0.5757 times |
Wed 30 April 2025 |
20.03 (2.25%) |
19.70 |
18.38 - 20.26 |
0.623 times |
Mon 31 March 2025 |
19.59 (-8.88%) |
21.60 |
19.46 - 21.62 |
0.4519 times |
Fri 28 February 2025 |
21.50 (1.51%) |
21.20 |
20.55 - 21.95 |
0.4118 times |

DMA SMA EMA moving averages of Brighthouse Financial BHFAP
DMA (daily moving average) of Brighthouse Financial BHFAP
| DMA period | DMA value | | 5 day DMA | 16.25 | | 12 day DMA | 16.14 | | 20 day DMA | 16.25 | | 35 day DMA | 16.07 | | 50 day DMA | 16.02 | | 100 day DMA | 16.57 | | 150 day DMA | 17.54 | | 200 day DMA | 18.2 | EMA (exponential moving average) of Brighthouse Financial BHFAP
| EMA period | EMA current | EMA prev | EMA prev2 | | 5 day EMA | 16.15 | 16.21 | 16.32 | | 12 day EMA | 16.18 | 16.21 | 16.25 | | 20 day EMA | 16.17 | 16.18 | 16.2 | | 35 day EMA | 16.16 | 16.17 | 16.18 | | 50 day EMA | 16.12 | 16.12 | 16.13 |
SMA (simple moving average) of Brighthouse Financial BHFAP
| SMA period | SMA current | SMA prev | SMA prev2 | | 5 day SMA | 16.25 | 16.34 | 16.38 | | 12 day SMA | 16.14 | 16.14 | 16.15 | | 20 day SMA | 16.25 | 16.32 | 16.29 | | 35 day SMA | 16.07 | 16.06 | 16.04 | | 50 day SMA | 16.02 | 16.04 | 16.05 | | 100 day SMA | 16.57 | 16.58 | 16.59 | | 150 day SMA | 17.54 | 17.56 | 17.59 | | 200 day SMA | 18.2 | 18.23 | 18.25 |
|
|
