BrighthouseFinancial BHFAO full analysis,charts,indicators,moving averages,SMA,DMA,EMA,ADX,MACD,RSIBrighthouse Financial BHFAO WideScreen charts, DMA,SMA,EMA technical analysis, forecast prediction, by indicators ADX,MACD,RSI,CCI NASDAQ stock exchange
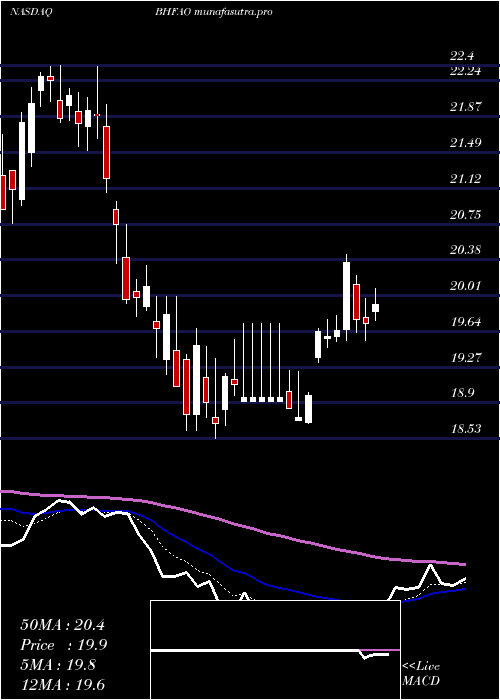
Daily price and charts and targets BrighthouseFinancial Strong Daily Stock price targets for BrighthouseFinancial BHFAO are 17.95 and 18.82 | Daily Target 1 | 17.79 | | Daily Target 2 | 18.1 | | Daily Target 3 | 18.66 | | Daily Target 4 | 18.97 | | Daily Target 5 | 19.53 |
Daily price and volume Brighthouse Financial
| Date |
Closing |
Open |
Range |
Volume |
Fri 11 July 2025 |
18.41 (-3.86%) |
19.11 |
18.35 - 19.22 |
1.4795 times |
Thu 10 July 2025 |
19.15 (0.26%) |
19.45 |
19.02 - 19.54 |
0.9533 times |
Wed 09 July 2025 |
19.10 (0.63%) |
19.09 |
18.95 - 19.45 |
0.8084 times |
Tue 08 July 2025 |
18.98 (-1.25%) |
19.06 |
18.88 - 19.40 |
1.0181 times |
Mon 07 July 2025 |
19.22 (-3.47%) |
19.99 |
19.02 - 19.99 |
0.6692 times |
Thu 03 July 2025 |
19.91 (0.1%) |
19.80 |
19.79 - 20.20 |
0.5205 times |
Wed 02 July 2025 |
19.89 (1.9%) |
19.66 |
19.35 - 19.91 |
0.8217 times |
Tue 01 July 2025 |
19.52 (1.04%) |
19.53 |
19.20 - 19.79 |
0.8236 times |
Mon 30 June 2025 |
19.32 (-0.62%) |
19.47 |
19.21 - 19.92 |
2.2936 times |
Fri 27 June 2025 |
19.44 (0.62%) |
19.32 |
19.20 - 19.80 |
0.612 times |
Thu 26 June 2025 |
19.32 (0.31%) |
19.55 |
19.18 - 19.69 |
1.2717 times |
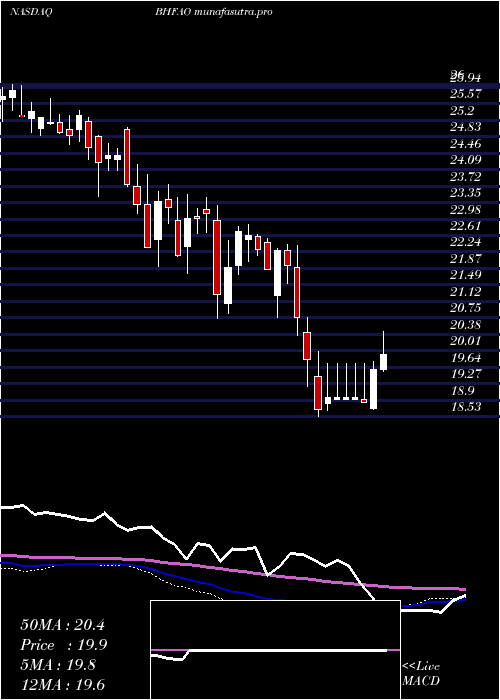
Weekly price and charts BrighthouseFinancial Strong weekly Stock price targets for BrighthouseFinancial BHFAO are 17.56 and 19.2 | Weekly Target 1 | 17.28 | | Weekly Target 2 | 17.84 | | Weekly Target 3 | 18.916666666667 | | Weekly Target 4 | 19.48 | | Weekly Target 5 | 20.56 |
Weekly price and volumes for Brighthouse Financial
| Date |
Closing |
Open |
Range |
Volume |
Fri 11 July 2025 |
18.41 (-7.53%) |
19.99 |
18.35 - 19.99 |
1.2791 times |
Thu 03 July 2025 |
19.91 (2.42%) |
19.47 |
19.20 - 20.20 |
1.1574 times |
Fri 27 June 2025 |
19.44 (-6%) |
20.73 |
19.10 - 21.25 |
1.1609 times |
Fri 20 June 2025 |
20.68 (3.76%) |
19.91 |
19.91 - 21.39 |
0.7665 times |
Fri 13 June 2025 |
19.93 (-7.39%) |
21.74 |
19.77 - 21.94 |
0.8803 times |
Fri 06 June 2025 |
21.52 (1.41%) |
21.31 |
20.80 - 21.93 |
0.5527 times |
Fri 30 May 2025 |
21.22 (6.15%) |
20.14 |
19.74 - 21.87 |
1.3177 times |
Fri 23 May 2025 |
19.99 (0.4%) |
19.80 |
19.60 - 20.45 |
0.9387 times |
Fri 16 May 2025 |
19.91 (3.27%) |
19.35 |
19.35 - 19.98 |
1.0268 times |
Fri 09 May 2025 |
19.28 (-3.21%) |
19.95 |
19.11 - 20.09 |
0.9199 times |
Fri 02 May 2025 |
19.92 (1.68%) |
19.59 |
19.54 - 20.44 |
1.0382 times |
Monthly price and charts BrighthouseFinancial Strong monthly Stock price targets for BrighthouseFinancial BHFAO are 17.46 and 19.31 | Monthly Target 1 | 17.14 | | Monthly Target 2 | 17.77 | | Monthly Target 3 | 18.986666666667 | | Monthly Target 4 | 19.62 | | Monthly Target 5 | 20.84 |
Monthly price and volumes Brighthouse Financial
| Date |
Closing |
Open |
Range |
Volume |
Fri 11 July 2025 |
18.41 (-4.71%) |
19.53 |
18.35 - 20.20 |
0.4733 times |
Mon 30 June 2025 |
19.32 (-8.95%) |
21.31 |
19.10 - 21.94 |
1.0168 times |
Fri 30 May 2025 |
21.22 (7.33%) |
19.79 |
19.11 - 21.87 |
1.1786 times |
Wed 30 April 2025 |
19.77 (-1%) |
20.05 |
18.53 - 20.44 |
1.2669 times |
Mon 31 March 2025 |
19.97 (-10.41%) |
22.45 |
19.93 - 22.54 |
0.9956 times |
Fri 28 February 2025 |
22.29 (4.75%) |
21.08 |
20.85 - 22.85 |
0.9817 times |
Fri 31 January 2025 |
21.28 (-3.8%) |
22.28 |
20.74 - 23.75 |
1.5265 times |
Tue 31 December 2024 |
22.12 (-9.38%) |
25.00 |
21.90 - 25.05 |
1.2953 times |
Tue 26 November 2024 |
24.41 (-1.17%) |
24.99 |
23.48 - 25.42 |
0.7025 times |
Thu 31 October 2024 |
24.70 (-1.4%) |
25.12 |
24.65 - 25.70 |
0.563 times |
Mon 30 September 2024 |
25.05 (-0.28%) |
25.23 |
24.92 - 26.00 |
0.5183 times |
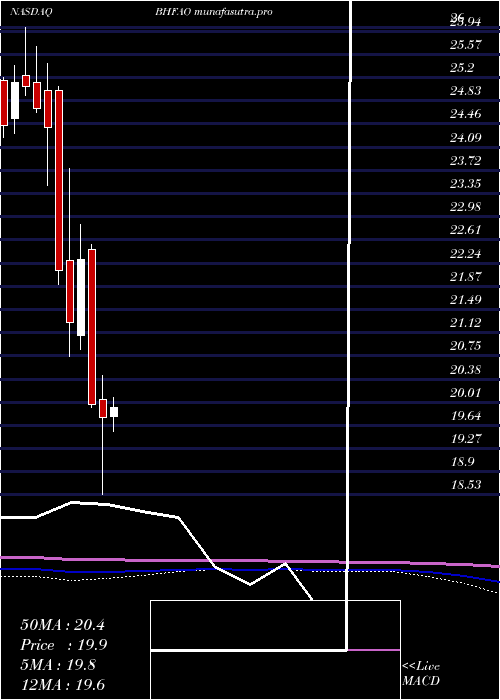
DMA SMA EMA moving averages of Brighthouse Financial BHFAO
DMA (daily moving average) of Brighthouse Financial BHFAO
| DMA period | DMA value | | 5 day DMA | 18.97 | | 12 day DMA | 19.29 | | 20 day DMA | 19.73 | | 35 day DMA | 20.25 | | 50 day DMA | 20.11 | | 100 day DMA | 20.44 | | 150 day DMA | 21.25 | | 200 day DMA | 22.21 | EMA (exponential moving average) of Brighthouse Financial BHFAO
| EMA period | EMA current | EMA prev | EMA prev2 | | 5 day EMA | 18.96 | 19.24 | 19.28 | | 12 day EMA | 19.35 | 19.52 | 19.59 | | 20 day EMA | 19.62 | 19.75 | 19.81 | | 35 day EMA | 19.75 | 19.83 | 19.87 | | 50 day EMA | 19.94 | 20 | 20.03 |
SMA (simple moving average) of Brighthouse Financial BHFAO
| SMA period | SMA current | SMA prev | SMA prev2 | | 5 day SMA | 18.97 | 19.27 | 19.42 | | 12 day SMA | 19.29 | 19.43 | 19.58 | | 20 day SMA | 19.73 | 19.87 | 19.99 | | 35 day SMA | 20.25 | 20.3 | 20.32 | | 50 day SMA | 20.11 | 20.14 | 20.14 | | 100 day SMA | 20.44 | 20.48 | 20.51 | | 150 day SMA | 21.25 | 21.29 | 21.32 | | 200 day SMA | 22.21 | 22.24 | 22.28 |
|
|
