BrighthouseFinancial BHFAN full analysis,charts,indicators,moving averages,SMA,DMA,EMA,ADX,MACD,RSIBrighthouse Financial BHFAN WideScreen charts, DMA,SMA,EMA technical analysis, forecast prediction, by indicators ADX,MACD,RSI,CCI NASDAQ stock exchange
Daily price and charts and targets BrighthouseFinancial Strong Daily Stock price targets for BrighthouseFinancial BHFAN are 13.22 and 13.39 | Daily Target 1 | 13.08 | | Daily Target 2 | 13.19 | | Daily Target 3 | 13.25 | | Daily Target 4 | 13.36 | | Daily Target 5 | 13.42 |
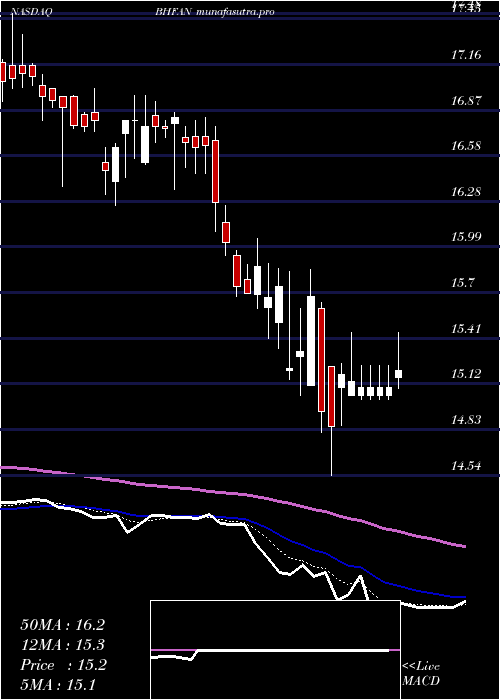
Daily price and volume Brighthouse Financial
| Date |
Closing |
Open |
Range |
Volume |
Fri 05 December 2025 |
13.30 (0.38%) |
13.19 |
13.14 - 13.31 |
0.7858 times |
Thu 04 December 2025 |
13.25 (-1.49%) |
13.41 |
13.03 - 13.59 |
0.8962 times |
Wed 03 December 2025 |
13.45 (0%) |
13.39 |
13.35 - 13.48 |
0.7889 times |
Tue 02 December 2025 |
13.45 (-1.82%) |
13.65 |
13.28 - 13.65 |
0.9622 times |
Mon 01 December 2025 |
13.70 (1.71%) |
13.60 |
13.25 - 13.89 |
2.3708 times |
Fri 28 November 2025 |
13.47 (2.2%) |
13.17 |
13.17 - 13.47 |
0.6126 times |
Wed 26 November 2025 |
13.18 (-0.23%) |
13.14 |
13.08 - 13.27 |
1.1952 times |
Tue 25 November 2025 |
13.21 (0.46%) |
13.11 |
13.05 - 13.22 |
0.4238 times |
Mon 24 November 2025 |
13.15 (0.77%) |
13.06 |
13.00 - 13.20 |
1.2499 times |
Fri 21 November 2025 |
13.05 (2.43%) |
12.67 |
12.54 - 13.05 |
0.7147 times |
Thu 20 November 2025 |
12.74 (-1.47%) |
12.90 |
12.60 - 12.98 |
1.3107 times |
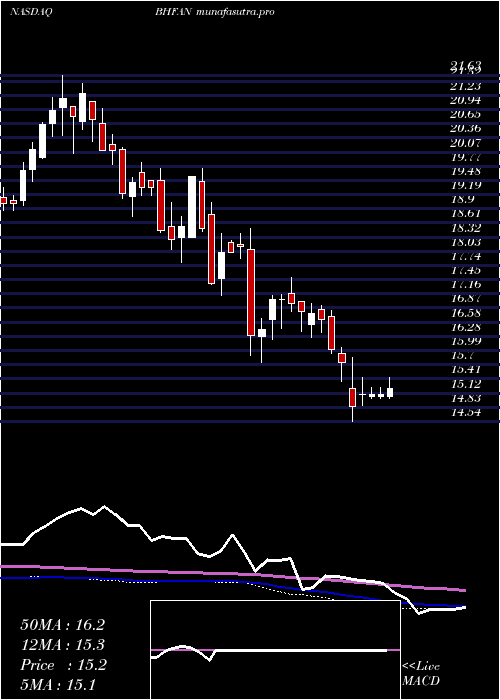
Weekly price and charts BrighthouseFinancial Strong weekly Stock price targets for BrighthouseFinancial BHFAN are 12.74 and 13.6 | Weekly Target 1 | 12.55 | | Weekly Target 2 | 12.92 | | Weekly Target 3 | 13.406666666667 | | Weekly Target 4 | 13.78 | | Weekly Target 5 | 14.27 |
Weekly price and volumes for Brighthouse Financial
| Date |
Closing |
Open |
Range |
Volume |
Fri 05 December 2025 |
13.30 (-1.26%) |
13.60 |
13.03 - 13.89 |
0.8183 times |
Fri 28 November 2025 |
13.47 (3.22%) |
13.06 |
13.00 - 13.47 |
0.4909 times |
Fri 21 November 2025 |
13.05 (-0.23%) |
13.06 |
12.54 - 13.17 |
0.5784 times |
Fri 14 November 2025 |
13.08 (-6.37%) |
13.81 |
13.00 - 14.05 |
0.8496 times |
Fri 07 November 2025 |
13.97 (9.57%) |
12.55 |
12.45 - 14.45 |
2.0247 times |
Fri 31 October 2025 |
12.75 (0%) |
12.80 |
12.58 - 13.00 |
0.3853 times |
Fri 31 October 2025 |
12.75 (-2.45%) |
13.07 |
12.58 - 13.30 |
0.7862 times |
Fri 24 October 2025 |
13.07 (-1.88%) |
13.35 |
12.40 - 13.61 |
1.8293 times |
Fri 17 October 2025 |
13.32 (5.71%) |
12.67 |
12.20 - 13.52 |
0.8977 times |
Fri 10 October 2025 |
12.60 (-3.82%) |
13.01 |
12.50 - 13.45 |
1.3395 times |
Fri 03 October 2025 |
13.10 (-3.68%) |
13.61 |
13.05 - 13.78 |
0.4329 times |
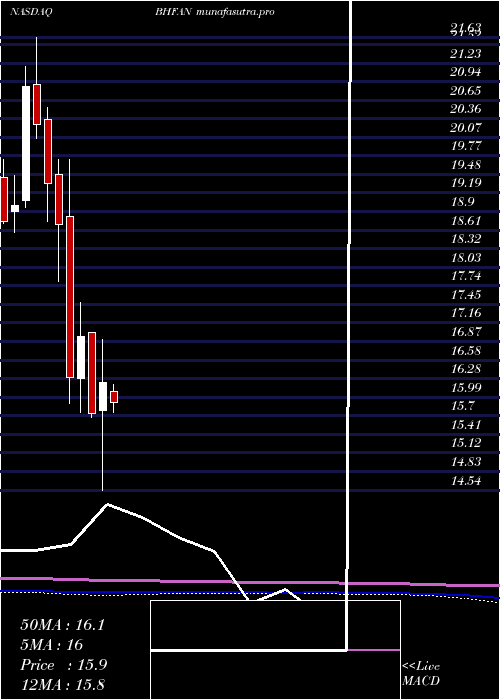
Monthly price and charts BrighthouseFinancial Strong monthly Stock price targets for BrighthouseFinancial BHFAN are 12.74 and 13.6 | Monthly Target 1 | 12.55 | | Monthly Target 2 | 12.92 | | Monthly Target 3 | 13.406666666667 | | Monthly Target 4 | 13.78 | | Monthly Target 5 | 14.27 |
Monthly price and volumes Brighthouse Financial
| Date |
Closing |
Open |
Range |
Volume |
Fri 05 December 2025 |
13.30 (-1.26%) |
13.60 |
13.03 - 13.89 |
0.2362 times |
Fri 28 November 2025 |
13.47 (5.65%) |
12.55 |
12.45 - 14.45 |
1.1382 times |
Fri 31 October 2025 |
12.75 (-5.76%) |
13.52 |
12.20 - 13.71 |
1.5745 times |
Tue 30 September 2025 |
13.53 (-9.44%) |
14.87 |
12.77 - 15.65 |
1.2237 times |
Fri 29 August 2025 |
14.94 (11.16%) |
13.44 |
13.34 - 15.15 |
1.043 times |
Thu 31 July 2025 |
13.44 (-9.13%) |
14.78 |
11.51 - 15.43 |
2.2113 times |
Mon 30 June 2025 |
14.79 (-13.2%) |
17.00 |
14.45 - 17.40 |
0.6881 times |
Fri 30 May 2025 |
17.04 (5.06%) |
16.08 |
15.55 - 17.20 |
0.5501 times |
Wed 30 April 2025 |
16.22 (3.05%) |
15.79 |
14.54 - 16.89 |
0.6285 times |
Mon 31 March 2025 |
15.74 (-7.14%) |
17.00 |
15.68 - 17.00 |
0.7063 times |
Fri 28 February 2025 |
16.95 (3.99%) |
16.28 |
15.75 - 17.48 |
0.5638 times |
DMA SMA EMA moving averages of Brighthouse Financial BHFAN
DMA (daily moving average) of Brighthouse Financial BHFAN
| DMA period | DMA value | | 5 day DMA | 13.43 | | 12 day DMA | 13.24 | | 20 day DMA | 13.31 | | 35 day DMA | 13.22 | | 50 day DMA | 13.18 | | 100 day DMA | 13.62 | | 150 day DMA | 14.38 | | 200 day DMA | 14.82 | EMA (exponential moving average) of Brighthouse Financial BHFAN
| EMA period | EMA current | EMA prev | EMA prev2 | | 5 day EMA | 13.34 | 13.36 | 13.42 | | 12 day EMA | 13.31 | 13.31 | 13.32 | | 20 day EMA | 13.28 | 13.28 | 13.28 | | 35 day EMA | 13.27 | 13.27 | 13.27 | | 50 day EMA | 13.26 | 13.26 | 13.26 |
SMA (simple moving average) of Brighthouse Financial BHFAN
| SMA period | SMA current | SMA prev | SMA prev2 | | 5 day SMA | 13.43 | 13.46 | 13.45 | | 12 day SMA | 13.24 | 13.23 | 13.22 | | 20 day SMA | 13.31 | 13.36 | 13.33 | | 35 day SMA | 13.22 | 13.2 | 13.19 | | 50 day SMA | 13.18 | 13.18 | 13.19 | | 100 day SMA | 13.62 | 13.62 | 13.63 | | 150 day SMA | 14.38 | 14.4 | 14.42 | | 200 day SMA | 14.82 | 14.84 | 14.86 |
|
|
