BrighthouseFinancial BHF full analysis,charts,indicators,moving averages,SMA,DMA,EMA,ADX,MACD,RSIBrighthouse Financial BHF WideScreen charts, DMA,SMA,EMA technical analysis, forecast prediction, by indicators ADX,MACD,RSI,CCI NASDAQ stock exchange
operates under Finance sector & deals in Life Insurance
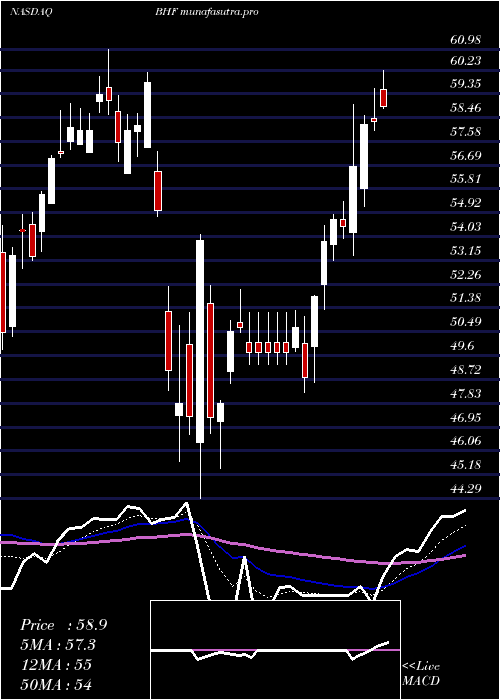
Daily price and charts and targets BrighthouseFinancial Strong Daily Stock price targets for BrighthouseFinancial BHF are 46.53 and 50.21 | Daily Target 1 | 45.78 | | Daily Target 2 | 47.28 | | Daily Target 3 | 49.456666666667 | | Daily Target 4 | 50.96 | | Daily Target 5 | 53.14 |
Daily price and volume Brighthouse Financial
| Date |
Closing |
Open |
Range |
Volume |
Fri 11 July 2025 |
48.79 (-6.41%) |
51.50 |
47.95 - 51.63 |
1.7743 times |
Thu 10 July 2025 |
52.13 (0.23%) |
52.08 |
51.74 - 52.59 |
0.7157 times |
Wed 09 July 2025 |
52.01 (-0.19%) |
52.84 |
51.79 - 52.84 |
0.6277 times |
Tue 08 July 2025 |
52.11 (2.78%) |
51.11 |
50.88 - 52.86 |
0.9148 times |
Mon 07 July 2025 |
50.70 (-4.95%) |
53.02 |
50.61 - 53.37 |
0.8703 times |
Thu 03 July 2025 |
53.34 (-0.82%) |
53.90 |
52.81 - 54.72 |
0.8342 times |
Wed 02 July 2025 |
53.78 (0%) |
53.94 |
52.27 - 54.18 |
1.2573 times |
Tue 01 July 2025 |
53.78 (0.02%) |
53.73 |
53.39 - 54.75 |
0.9361 times |
Mon 30 June 2025 |
53.77 (-1.23%) |
54.43 |
53.47 - 54.90 |
0.9059 times |
Fri 27 June 2025 |
54.44 (1.11%) |
53.84 |
53.76 - 54.83 |
1.1637 times |
Thu 26 June 2025 |
53.84 (1.76%) |
53.10 |
52.61 - 53.99 |
0.9912 times |
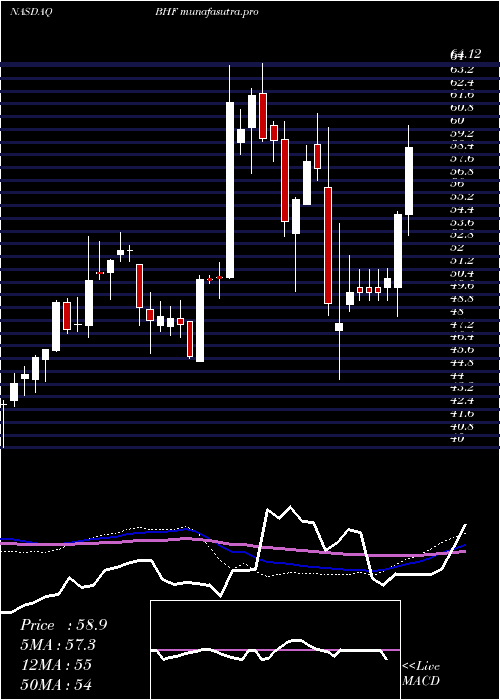
Weekly price and charts BrighthouseFinancial Strong weekly Stock price targets for BrighthouseFinancial BHF are 45.66 and 51.08 | Weekly Target 1 | 44.62 | | Weekly Target 2 | 46.7 | | Weekly Target 3 | 50.036666666667 | | Weekly Target 4 | 52.12 | | Weekly Target 5 | 55.46 |
Weekly price and volumes for Brighthouse Financial
| Date |
Closing |
Open |
Range |
Volume |
Fri 11 July 2025 |
48.79 (-8.53%) |
53.02 |
47.95 - 53.37 |
1.1388 times |
Thu 03 July 2025 |
53.34 (-2.02%) |
54.43 |
52.27 - 54.90 |
0.9136 times |
Fri 27 June 2025 |
54.44 (-7.51%) |
58.67 |
51.35 - 62.73 |
1.8853 times |
Fri 20 June 2025 |
58.86 (3.19%) |
57.72 |
57.51 - 60.10 |
0.6382 times |
Fri 13 June 2025 |
57.04 (-3.83%) |
59.66 |
55.78 - 59.66 |
0.5709 times |
Fri 06 June 2025 |
59.31 (-0.84%) |
59.51 |
57.31 - 60.11 |
0.6764 times |
Fri 30 May 2025 |
59.81 (3.28%) |
58.85 |
58.08 - 60.94 |
0.8171 times |
Fri 23 May 2025 |
57.91 (-5.05%) |
60.31 |
57.22 - 61.99 |
0.856 times |
Fri 16 May 2025 |
60.99 (3.83%) |
61.35 |
58.90 - 62.58 |
1.1107 times |
Fri 09 May 2025 |
58.74 (-0.25%) |
58.00 |
56.13 - 60.10 |
1.393 times |
Fri 02 May 2025 |
58.89 (7.72%) |
54.66 |
53.35 - 60.23 |
1.8488 times |
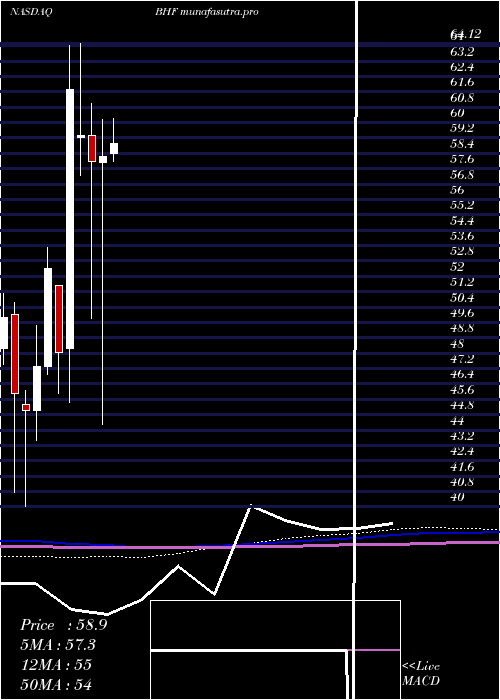
Monthly price and charts BrighthouseFinancial Strong monthly Stock price targets for BrighthouseFinancial BHF are 44.97 and 51.77 | Monthly Target 1 | 43.7 | | Monthly Target 2 | 46.24 | | Monthly Target 3 | 50.496666666667 | | Monthly Target 4 | 53.04 | | Monthly Target 5 | 57.3 |
Monthly price and volumes Brighthouse Financial
| Date |
Closing |
Open |
Range |
Volume |
Fri 11 July 2025 |
48.79 (-9.26%) |
53.73 |
47.95 - 54.75 |
0.5516 times |
Mon 30 June 2025 |
53.77 (-10.1%) |
59.51 |
51.35 - 62.73 |
1.1923 times |
Fri 30 May 2025 |
59.81 (2.73%) |
58.41 |
56.13 - 62.58 |
1.3597 times |
Wed 30 April 2025 |
58.22 (0.4%) |
57.93 |
44.29 - 60.14 |
1.8216 times |
Mon 31 March 2025 |
57.99 (-2.23%) |
59.33 |
49.82 - 60.98 |
1.0706 times |
Fri 28 February 2025 |
59.31 (-3.89%) |
59.20 |
57.24 - 64.12 |
1.3356 times |
Fri 31 January 2025 |
61.71 (28.43%) |
48.26 |
45.42 - 64.00 |
1.0178 times |
Tue 31 December 2024 |
48.05 (-8.34%) |
51.54 |
45.93 - 51.54 |
0.3914 times |
Tue 26 November 2024 |
52.42 (10.82%) |
47.30 |
46.92 - 53.50 |
0.6295 times |
Thu 31 October 2024 |
47.30 (5.04%) |
45.00 |
43.45 - 49.42 |
0.6299 times |
Mon 30 September 2024 |
45.03 (-1.9%) |
45.35 |
40.00 - 46.08 |
0.5627 times |
DMA SMA EMA moving averages of Brighthouse Financial BHF
DMA (daily moving average) of Brighthouse Financial BHF
| DMA period | DMA value | | 5 day DMA | 51.15 | | 12 day DMA | 52.63 | | 20 day DMA | 54.61 | | 35 day DMA | 56.5 | | 50 day DMA | 57.2 | | 100 day DMA | 56 | | 150 day DMA | 54.67 | | 200 day DMA | 52.9 | EMA (exponential moving average) of Brighthouse Financial BHF
| EMA period | EMA current | EMA prev | EMA prev2 | | 5 day EMA | 51.13 | 52.3 | 52.38 | | 12 day EMA | 52.71 | 53.42 | 53.66 | | 20 day EMA | 53.93 | 54.47 | 54.72 | | 35 day EMA | 55.14 | 55.51 | 55.71 | | 50 day EMA | 56.22 | 56.52 | 56.7 |
SMA (simple moving average) of Brighthouse Financial BHF
| SMA period | SMA current | SMA prev | SMA prev2 | | 5 day SMA | 51.15 | 52.06 | 52.39 | | 12 day SMA | 52.63 | 53.06 | 53.62 | | 20 day SMA | 54.61 | 55.06 | 55.4 | | 35 day SMA | 56.5 | 56.85 | 57.1 | | 50 day SMA | 57.2 | 57.31 | 57.36 | | 100 day SMA | 56 | 56.13 | 56.2 | | 150 day SMA | 54.67 | 54.69 | 54.69 | | 200 day SMA | 52.9 | 52.87 | 52.82 |
|
|
