BusinessFirst BFST full analysis,charts,indicators,moving averages,SMA,DMA,EMA,ADX,MACD,RSIBusiness First BFST WideScreen charts, DMA,SMA,EMA technical analysis, forecast prediction, by indicators ADX,MACD,RSI,CCI NASDAQ stock exchange
operates under Finance sector & deals in Major Banks
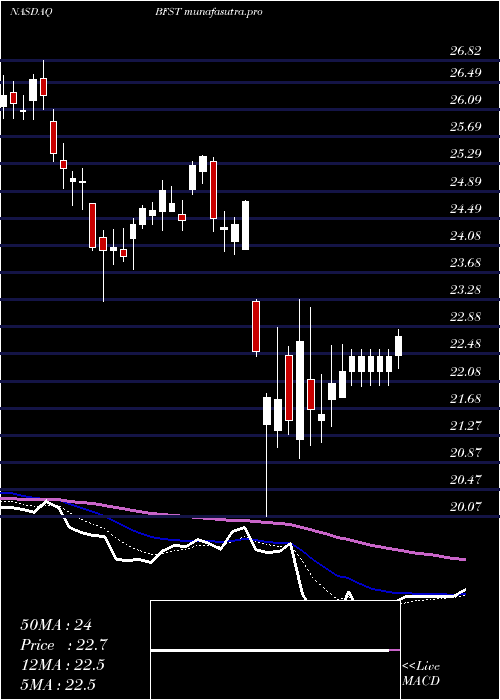
Daily price and charts and targets BusinessFirst Strong Daily Stock price targets for BusinessFirst BFST are 26.77 and 27.08 | Daily Target 1 | 26.54 | | Daily Target 2 | 26.68 | | Daily Target 3 | 26.853333333333 | | Daily Target 4 | 26.99 | | Daily Target 5 | 27.16 |
Daily price and volume Business First
| Date |
Closing |
Open |
Range |
Volume |
Fri 05 December 2025 |
26.81 (-0.26%) |
26.74 |
26.72 - 27.03 |
0.7664 times |
Thu 04 December 2025 |
26.88 (-0.07%) |
26.80 |
26.68 - 26.93 |
0.6244 times |
Wed 03 December 2025 |
26.90 (2.44%) |
26.38 |
26.38 - 26.92 |
0.9102 times |
Tue 02 December 2025 |
26.26 (-0.11%) |
26.50 |
26.21 - 26.55 |
0.5814 times |
Mon 01 December 2025 |
26.29 (1.04%) |
25.81 |
25.81 - 26.45 |
0.7037 times |
Fri 28 November 2025 |
26.02 (-0.88%) |
26.40 |
25.98 - 26.40 |
0.3807 times |
Wed 26 November 2025 |
26.25 (-0.83%) |
26.40 |
26.08 - 26.65 |
1.2176 times |
Tue 25 November 2025 |
26.47 (3.44%) |
25.79 |
25.79 - 26.58 |
1.1344 times |
Mon 24 November 2025 |
25.59 (-0.51%) |
25.70 |
25.11 - 25.70 |
1.5592 times |
Fri 21 November 2025 |
25.72 (2.88%) |
25.00 |
25.00 - 25.88 |
2.122 times |
Thu 20 November 2025 |
25.00 (1.42%) |
24.77 |
24.65 - 25.25 |
2.1895 times |
Weekly price and charts BusinessFirst Strong weekly Stock price targets for BusinessFirst BFST are 26.31 and 27.53 | Weekly Target 1 | 25.33 | | Weekly Target 2 | 26.07 | | Weekly Target 3 | 26.55 | | Weekly Target 4 | 27.29 | | Weekly Target 5 | 27.77 |
Weekly price and volumes for Business First
| Date |
Closing |
Open |
Range |
Volume |
Fri 05 December 2025 |
26.81 (3.04%) |
25.81 |
25.81 - 27.03 |
0.7284 times |
Fri 28 November 2025 |
26.02 (1.17%) |
25.70 |
25.11 - 26.65 |
0.8718 times |
Fri 21 November 2025 |
25.72 (2.14%) |
25.11 |
24.19 - 25.88 |
1.9823 times |
Fri 14 November 2025 |
25.18 (2.11%) |
24.78 |
24.60 - 25.50 |
0.9511 times |
Fri 07 November 2025 |
24.66 (0.57%) |
24.53 |
24.50 - 25.15 |
0.6181 times |
Fri 31 October 2025 |
24.52 (0%) |
24.50 |
24.39 - 24.71 |
0.2883 times |
Fri 31 October 2025 |
24.52 (-1.96%) |
25.01 |
23.55 - 25.82 |
1.427 times |
Fri 24 October 2025 |
25.01 (9.64%) |
23.03 |
22.81 - 25.49 |
1.1805 times |
Fri 17 October 2025 |
22.81 (0%) |
23.07 |
22.56 - 24.18 |
1.0262 times |
Fri 10 October 2025 |
22.81 (-2.4%) |
23.61 |
22.76 - 23.98 |
0.9262 times |
Fri 03 October 2025 |
23.37 (-3.47%) |
24.27 |
23.04 - 24.27 |
0.8774 times |
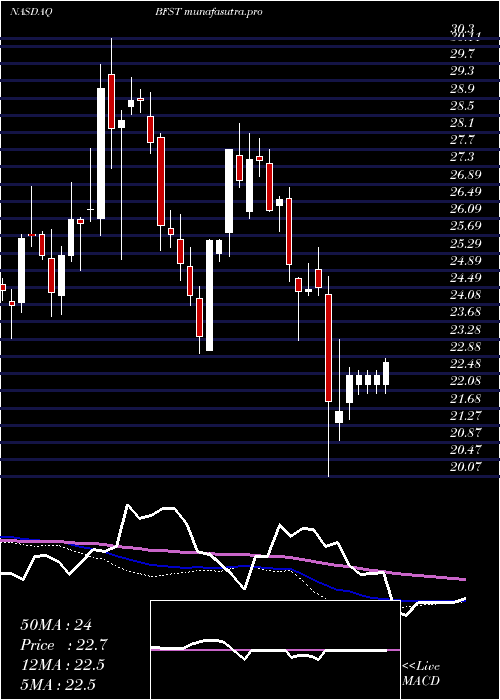
Monthly price and charts BusinessFirst Strong monthly Stock price targets for BusinessFirst BFST are 26.31 and 27.53 | Monthly Target 1 | 25.33 | | Monthly Target 2 | 26.07 | | Monthly Target 3 | 26.55 | | Monthly Target 4 | 27.29 | | Monthly Target 5 | 27.77 |
Monthly price and volumes Business First
| Date |
Closing |
Open |
Range |
Volume |
Fri 05 December 2025 |
26.81 (3.04%) |
25.81 |
25.81 - 27.03 |
0.1877 times |
Fri 28 November 2025 |
26.02 (6.12%) |
24.53 |
24.19 - 26.65 |
1.1396 times |
Fri 31 October 2025 |
24.52 (3.85%) |
23.41 |
22.56 - 25.82 |
1.3795 times |
Tue 30 September 2025 |
23.61 (-5.6%) |
24.67 |
23.40 - 25.95 |
0.9976 times |
Fri 29 August 2025 |
25.01 (5.31%) |
23.38 |
22.62 - 25.61 |
0.9854 times |
Thu 31 July 2025 |
23.75 (-3.65%) |
24.50 |
23.48 - 26.63 |
1.0506 times |
Mon 30 June 2025 |
24.65 (3.61%) |
23.69 |
22.52 - 24.99 |
1.1943 times |
Fri 30 May 2025 |
23.79 (3.21%) |
23.06 |
22.74 - 25.11 |
0.8946 times |
Wed 30 April 2025 |
23.05 (-5.34%) |
24.14 |
20.07 - 24.75 |
1.3716 times |
Mon 31 March 2025 |
24.35 (-8.22%) |
26.55 |
23.25 - 26.82 |
0.7992 times |
Fri 28 February 2025 |
26.53 (-1.7%) |
26.26 |
25.79 - 28.08 |
0.8197 times |

DMA SMA EMA moving averages of Business First BFST
DMA (daily moving average) of Business First BFST
| DMA period | DMA value | | 5 day DMA | 26.63 | | 12 day DMA | 26.07 | | 20 day DMA | 25.61 | | 35 day DMA | 24.99 | | 50 day DMA | 24.54 | | 100 day DMA | 24.56 | | 150 day DMA | 24.5 | | 200 day DMA | 24.35 | EMA (exponential moving average) of Business First BFST
| EMA period | EMA current | EMA prev | EMA prev2 | | 5 day EMA | 26.63 | 26.54 | 26.37 | | 12 day EMA | 26.16 | 26.04 | 25.89 | | 20 day EMA | 25.76 | 25.65 | 25.52 | | 35 day EMA | 25.2 | 25.11 | 25.01 | | 50 day EMA | 24.72 | 24.63 | 24.54 |
SMA (simple moving average) of Business First BFST
| SMA period | SMA current | SMA prev | SMA prev2 | | 5 day SMA | 26.63 | 26.47 | 26.34 | | 12 day SMA | 26.07 | 25.87 | 25.65 | | 20 day SMA | 25.61 | 25.5 | 25.41 | | 35 day SMA | 24.99 | 24.87 | 24.79 | | 50 day SMA | 24.54 | 24.48 | 24.43 | | 100 day SMA | 24.56 | 24.55 | 24.53 | | 150 day SMA | 24.5 | 24.48 | 24.45 | | 200 day SMA | 24.35 | 24.35 | 24.35 |
|
|
