BelFuse BELFB full analysis,charts,indicators,moving averages,SMA,DMA,EMA,ADX,MACD,RSIBel Fuse BELFB WideScreen charts, DMA,SMA,EMA technical analysis, forecast prediction, by indicators ADX,MACD,RSI,CCI NASDAQ stock exchange
operates under Capital Goods sector & deals in Electrical Products
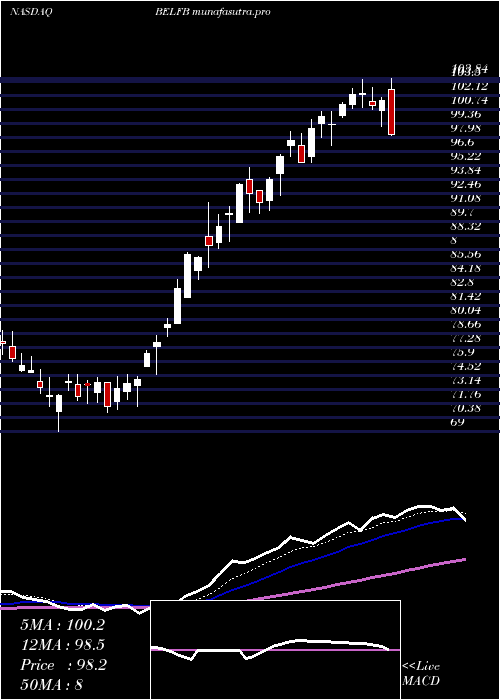
Daily price and charts and targets BelFuse Strong Daily Stock price targets for BelFuse BELFB are 163.34 and 169.11 | Daily Target 1 | 158.6 | | Daily Target 2 | 162.3 | | Daily Target 3 | 164.37 | | Daily Target 4 | 168.07 | | Daily Target 5 | 170.14 |
Daily price and volume Bel Fuse
| Date |
Closing |
Open |
Range |
Volume |
Fri 05 December 2025 |
166.00 (1.72%) |
163.52 |
160.67 - 166.44 |
0.7962 times |
Thu 04 December 2025 |
163.19 (2.16%) |
157.69 |
157.00 - 165.88 |
0.5823 times |
Wed 03 December 2025 |
159.74 (-1.12%) |
160.00 |
156.17 - 163.26 |
1.5803 times |
Tue 02 December 2025 |
161.55 (4.38%) |
155.01 |
154.77 - 162.99 |
1.359 times |
Mon 01 December 2025 |
154.77 (0.48%) |
152.36 |
151.00 - 157.34 |
0.7821 times |
Fri 28 November 2025 |
154.03 (0.88%) |
154.52 |
150.64 - 159.47 |
0.5364 times |
Wed 26 November 2025 |
152.69 (1.23%) |
150.41 |
149.52 - 155.39 |
0.7321 times |
Tue 25 November 2025 |
150.84 (3.4%) |
146.30 |
143.81 - 151.29 |
1.1026 times |
Mon 24 November 2025 |
145.88 (3.5%) |
141.91 |
140.17 - 146.22 |
0.7901 times |
Fri 21 November 2025 |
140.95 (4.9%) |
134.36 |
134.14 - 142.10 |
1.7389 times |
Thu 20 November 2025 |
134.36 (-7.27%) |
148.58 |
133.71 - 152.26 |
1.4217 times |
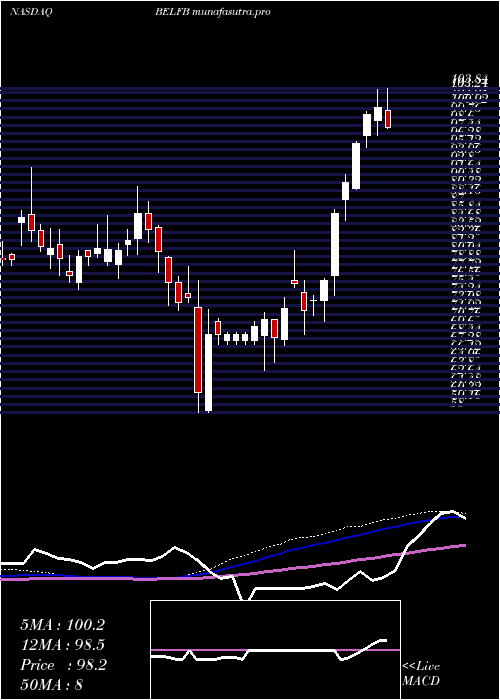
Weekly price and charts BelFuse Strong weekly Stock price targets for BelFuse BELFB are 158.5 and 173.94 | Weekly Target 1 | 145.71 | | Weekly Target 2 | 155.85 | | Weekly Target 3 | 161.14666666667 | | Weekly Target 4 | 171.29 | | Weekly Target 5 | 176.59 |
Weekly price and volumes for Bel Fuse
| Date |
Closing |
Open |
Range |
Volume |
Fri 05 December 2025 |
166.00 (7.77%) |
152.36 |
151.00 - 166.44 |
1.0196 times |
Fri 28 November 2025 |
154.03 (9.28%) |
141.91 |
140.17 - 159.47 |
0.632 times |
Fri 21 November 2025 |
140.95 (-4.55%) |
146.76 |
133.71 - 152.26 |
1.3749 times |
Fri 14 November 2025 |
147.67 (-8.58%) |
165.00 |
142.52 - 167.04 |
1.2663 times |
Fri 07 November 2025 |
161.53 (4.9%) |
155.83 |
143.13 - 161.66 |
1.1579 times |
Fri 31 October 2025 |
153.99 (0%) |
154.35 |
148.79 - 155.91 |
0.2797 times |
Fri 31 October 2025 |
153.99 (-1.92%) |
157.20 |
129.94 - 159.31 |
1.3179 times |
Fri 24 October 2025 |
157.00 (7.45%) |
147.94 |
143.48 - 159.75 |
0.8253 times |
Fri 17 October 2025 |
146.11 (6.08%) |
139.10 |
139.10 - 152.85 |
0.9891 times |
Fri 10 October 2025 |
137.73 (-0.89%) |
139.37 |
137.36 - 149.16 |
1.1372 times |
Fri 03 October 2025 |
138.97 (-2.71%) |
142.86 |
130.87 - 144.86 |
0.6247 times |
Monthly price and charts BelFuse Strong monthly Stock price targets for BelFuse BELFB are 158.5 and 173.94 | Monthly Target 1 | 145.71 | | Monthly Target 2 | 155.85 | | Monthly Target 3 | 161.14666666667 | | Monthly Target 4 | 171.29 | | Monthly Target 5 | 176.59 |
Monthly price and volumes Bel Fuse
| Date |
Closing |
Open |
Range |
Volume |
Fri 05 December 2025 |
166.00 (7.77%) |
152.36 |
151.00 - 166.44 |
0.2958 times |
Fri 28 November 2025 |
154.03 (0.03%) |
155.83 |
133.71 - 167.04 |
1.2854 times |
Fri 31 October 2025 |
153.99 (9.2%) |
140.09 |
129.94 - 159.75 |
1.4247 times |
Tue 30 September 2025 |
141.02 (4.8%) |
131.77 |
130.13 - 152.45 |
0.909 times |
Fri 29 August 2025 |
134.56 (3.48%) |
126.03 |
123.14 - 141.80 |
1.1041 times |
Thu 31 July 2025 |
130.04 (33.11%) |
97.24 |
95.45 - 131.68 |
1.5425 times |
Mon 30 June 2025 |
97.69 (32.37%) |
73.80 |
70.87 - 98.55 |
1.2802 times |
Fri 30 May 2025 |
73.80 (12.21%) |
66.39 |
65.90 - 80.90 |
0.6499 times |
Wed 30 April 2025 |
65.77 (-12.14%) |
74.55 |
58.00 - 76.72 |
0.8233 times |
Mon 31 March 2025 |
74.86 (-10.79%) |
84.21 |
71.97 - 84.51 |
0.685 times |
Fri 28 February 2025 |
83.91 (3.46%) |
78.99 |
76.90 - 90.00 |
0.6793 times |
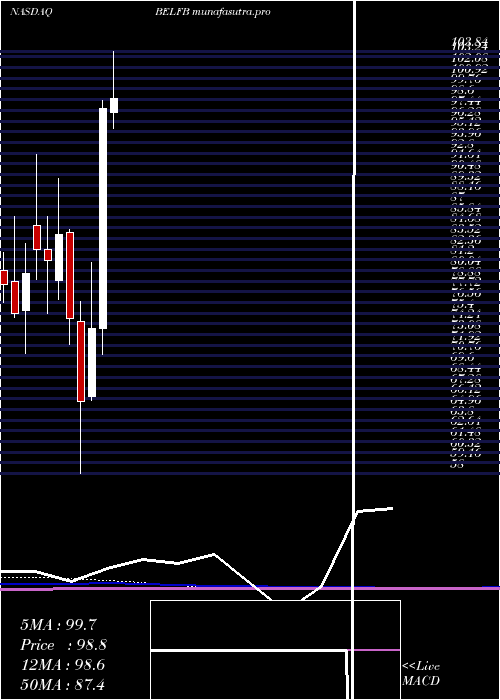
DMA SMA EMA moving averages of Bel Fuse BELFB
DMA (daily moving average) of Bel Fuse BELFB
| DMA period | DMA value | | 5 day DMA | 161.05 | | 12 day DMA | 152.41 | | 20 day DMA | 152.17 | | 35 day DMA | 152.47 | | 50 day DMA | 149.73 | | 100 day DMA | 141.22 | | 150 day DMA | 122.08 | | 200 day DMA | 109.94 | EMA (exponential moving average) of Bel Fuse BELFB
| EMA period | EMA current | EMA prev | EMA prev2 | | 5 day EMA | 161.17 | 158.75 | 156.53 | | 12 day EMA | 156.17 | 154.38 | 152.78 | | 20 day EMA | 153.97 | 152.7 | 151.6 | | 35 day EMA | 151.41 | 150.55 | 149.81 | | 50 day EMA | 150.43 | 149.79 | 149.24 |
SMA (simple moving average) of Bel Fuse BELFB
| SMA period | SMA current | SMA prev | SMA prev2 | | 5 day SMA | 161.05 | 158.66 | 156.56 | | 12 day SMA | 152.41 | 150.58 | 148.8 | | 20 day SMA | 152.17 | 151.88 | 151.46 | | 35 day SMA | 152.47 | 151.98 | 151.63 | | 50 day SMA | 149.73 | 149.26 | 148.85 | | 100 day SMA | 141.22 | 140.55 | 139.9 | | 150 day SMA | 122.08 | 121.42 | 120.77 | | 200 day SMA | 109.94 | 109.53 | 109.12 |
|
|
