BelFuse BELFA full analysis,charts,indicators,moving averages,SMA,DMA,EMA,ADX,MACD,RSIBel Fuse BELFA WideScreen charts, DMA,SMA,EMA technical analysis, forecast prediction, by indicators ADX,MACD,RSI,CCI NASDAQ stock exchange
operates under Capital Goods sector & deals in Electrical Products
Daily price and charts and targets BelFuse Strong Daily Stock price targets for BelFuse BELFA are 143.92 and 147.83 | Daily Target 1 | 140.9 | | Daily Target 2 | 143.02 | | Daily Target 3 | 144.80666666667 | | Daily Target 4 | 146.93 | | Daily Target 5 | 148.72 |
Daily price and volume Bel Fuse
| Date |
Closing |
Open |
Range |
Volume |
Fri 05 December 2025 |
145.15 (2.05%) |
142.68 |
142.68 - 146.59 |
2.0017 times |
Thu 04 December 2025 |
142.24 (2.08%) |
139.39 |
138.83 - 142.89 |
1.7373 times |
Wed 03 December 2025 |
139.34 (1.46%) |
136.35 |
134.98 - 139.34 |
0.7344 times |
Tue 02 December 2025 |
137.33 (4%) |
134.12 |
134.12 - 138.15 |
0.5833 times |
Mon 01 December 2025 |
132.05 (0.39%) |
130.00 |
130.00 - 134.00 |
0.2434 times |
Fri 28 November 2025 |
131.54 (1.85%) |
130.00 |
130.00 - 132.45 |
0.4364 times |
Wed 26 November 2025 |
129.15 (2.09%) |
128.10 |
127.50 - 129.82 |
0.491 times |
Tue 25 November 2025 |
126.50 (0.12%) |
126.70 |
123.71 - 127.00 |
0.684 times |
Mon 24 November 2025 |
126.35 (4.83%) |
119.80 |
118.58 - 126.77 |
1.3051 times |
Fri 21 November 2025 |
120.53 (5.71%) |
116.35 |
114.87 - 120.53 |
1.7835 times |
Thu 20 November 2025 |
114.02 (-6.85%) |
125.88 |
114.02 - 129.90 |
3.974 times |
Weekly price and charts BelFuse Strong weekly Stock price targets for BelFuse BELFA are 137.58 and 154.17 | Weekly Target 1 | 123.99 | | Weekly Target 2 | 134.57 | | Weekly Target 3 | 140.58 | | Weekly Target 4 | 151.16 | | Weekly Target 5 | 157.17 |
Weekly price and volumes for Bel Fuse
| Date |
Closing |
Open |
Range |
Volume |
Fri 05 December 2025 |
145.15 (10.35%) |
130.00 |
130.00 - 146.59 |
1.3722 times |
Fri 28 November 2025 |
131.54 (9.13%) |
119.80 |
118.58 - 132.45 |
0.7551 times |
Fri 21 November 2025 |
120.53 (-0.68%) |
120.59 |
114.02 - 129.90 |
3.4148 times |
Fri 14 November 2025 |
121.35 (-11.28%) |
139.02 |
121.35 - 142.70 |
0.8801 times |
Fri 07 November 2025 |
136.78 (0.04%) |
135.69 |
134.30 - 140.73 |
0.6953 times |
Fri 31 October 2025 |
136.73 (0%) |
133.00 |
131.05 - 136.73 |
0.05 times |
Fri 31 October 2025 |
136.73 (-1.45%) |
140.10 |
119.85 - 141.50 |
0.8181 times |
Fri 24 October 2025 |
138.74 (12.36%) |
125.48 |
123.58 - 140.50 |
1.0811 times |
Fri 17 October 2025 |
123.48 (11.57%) |
115.14 |
114.38 - 127.60 |
0.6302 times |
Fri 10 October 2025 |
110.67 (-2.38%) |
113.50 |
110.67 - 119.84 |
0.3031 times |
Fri 03 October 2025 |
113.37 (-4.75%) |
119.04 |
113.37 - 121.64 |
0.1445 times |

Monthly price and charts BelFuse Strong monthly Stock price targets for BelFuse BELFA are 137.58 and 154.17 | Monthly Target 1 | 123.99 | | Monthly Target 2 | 134.57 | | Monthly Target 3 | 140.58 | | Monthly Target 4 | 151.16 | | Monthly Target 5 | 157.17 |
Monthly price and volumes Bel Fuse
| Date |
Closing |
Open |
Range |
Volume |
Fri 05 December 2025 |
145.15 (10.35%) |
130.00 |
130.00 - 146.59 |
0.6379 times |
Fri 28 November 2025 |
131.54 (-3.8%) |
135.69 |
114.02 - 142.70 |
2.6709 times |
Fri 31 October 2025 |
136.73 (17.52%) |
121.64 |
110.67 - 141.50 |
1.3768 times |
Tue 30 September 2025 |
116.35 (1.68%) |
110.67 |
110.67 - 126.80 |
1.042 times |
Fri 29 August 2025 |
114.43 (-0.09%) |
111.24 |
107.51 - 119.30 |
0.697 times |
Thu 31 July 2025 |
114.53 (27.47%) |
88.81 |
87.67 - 117.23 |
0.7901 times |
Mon 30 June 2025 |
89.85 (41.47%) |
62.79 |
62.78 - 90.28 |
1.3981 times |
Fri 30 May 2025 |
63.51 (3.44%) |
61.70 |
61.70 - 72.77 |
0.4025 times |
Wed 30 April 2025 |
61.40 (-14.79%) |
71.56 |
53.95 - 74.05 |
0.4937 times |
Mon 31 March 2025 |
72.06 (-11.59%) |
82.00 |
70.61 - 83.51 |
0.4909 times |
Fri 28 February 2025 |
81.51 (-1.33%) |
81.11 |
80.00 - 89.66 |
0.7511 times |

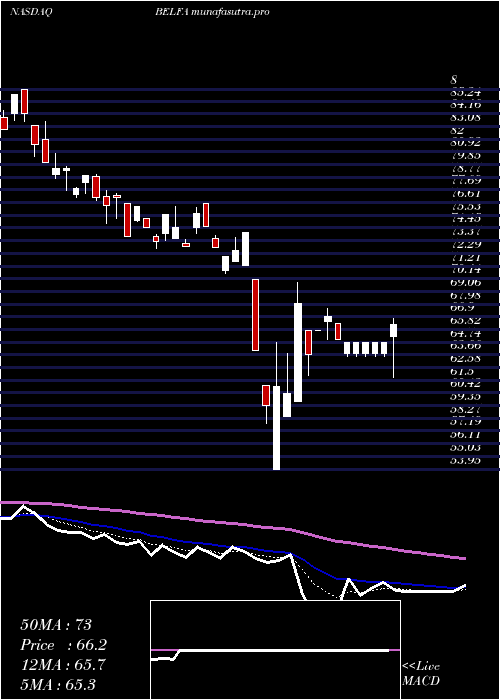
DMA SMA EMA moving averages of Bel Fuse BELFA
DMA (daily moving average) of Bel Fuse BELFA
| DMA period | DMA value | | 5 day DMA | 139.22 | | 12 day DMA | 130.55 | | 20 day DMA | 129.46 | | 35 day DMA | 131.38 | | 50 day DMA | 126.92 | | 100 day DMA | 120.26 | | 150 day DMA | 105.45 | | 200 day DMA | 96.93 | EMA (exponential moving average) of Bel Fuse BELFA
| EMA period | EMA current | EMA prev | EMA prev2 | | 5 day EMA | 139.68 | 136.94 | 134.29 | | 12 day EMA | 134.22 | 132.23 | 130.41 | | 20 day EMA | 131.96 | 130.57 | 129.34 | | 35 day EMA | 128.76 | 127.8 | 126.95 | | 50 day EMA | 127.63 | 126.92 | 126.3 |
SMA (simple moving average) of Bel Fuse BELFA
| SMA period | SMA current | SMA prev | SMA prev2 | | 5 day SMA | 139.22 | 136.5 | 133.88 | | 12 day SMA | 130.55 | 128.41 | 126.26 | | 20 day SMA | 129.46 | 129.18 | 128.97 | | 35 day SMA | 131.38 | 130.81 | 130.15 | | 50 day SMA | 126.92 | 126.41 | 125.95 | | 100 day SMA | 120.26 | 119.7 | 119.17 | | 150 day SMA | 105.45 | 104.91 | 104.37 | | 200 day SMA | 96.93 | 96.62 | 96.32 |
|
|
