BiodesixInc BDSX full analysis,charts,indicators,moving averages,SMA,DMA,EMA,ADX,MACD,RSIBiodesix Inc BDSX WideScreen charts, DMA,SMA,EMA technical analysis, forecast prediction, by indicators ADX,MACD,RSI,CCI NASDAQ stock exchange
Daily price and charts and targets BiodesixInc Strong Daily Stock price targets for BiodesixInc BDSX are 0.3 and 0.32 | Daily Target 1 | 0.29 | | Daily Target 2 | 0.3 | | Daily Target 3 | 0.31 | | Daily Target 4 | 0.32 | | Daily Target 5 | 0.33 |
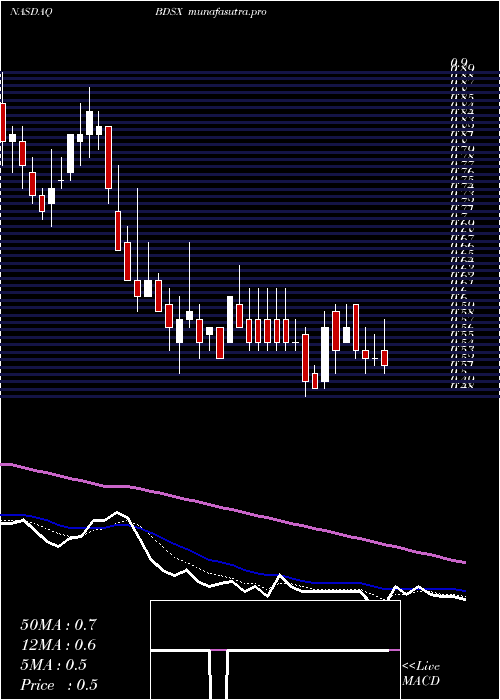
Daily price and volume Biodesix Inc
| Date |
Closing |
Open |
Range |
Volume |
Fri 11 July 2025 |
0.31 (0%) |
0.32 |
0.30 - 0.32 |
0.491 times |
Thu 10 July 2025 |
0.31 (-3.13%) |
0.31 |
0.30 - 0.32 |
0.6181 times |
Wed 09 July 2025 |
0.32 (10.34%) |
0.30 |
0.30 - 0.32 |
1.3194 times |
Tue 08 July 2025 |
0.29 (3.57%) |
0.28 |
0.28 - 0.30 |
1.177 times |
Mon 07 July 2025 |
0.28 (3.7%) |
0.27 |
0.27 - 0.28 |
0.6778 times |
Thu 03 July 2025 |
0.27 (-3.57%) |
0.29 |
0.27 - 0.29 |
0.5378 times |
Wed 02 July 2025 |
0.28 (-3.45%) |
0.29 |
0.27 - 0.29 |
0.6735 times |
Tue 01 July 2025 |
0.29 (3.57%) |
0.28 |
0.27 - 0.31 |
1.5458 times |
Mon 30 June 2025 |
0.28 (12%) |
0.27 |
0.26 - 0.29 |
1.8369 times |
Fri 27 June 2025 |
0.25 (-10.71%) |
0.27 |
0.25 - 0.28 |
1.1226 times |
Thu 26 June 2025 |
0.28 (3.7%) |
0.27 |
0.27 - 0.28 |
1.108 times |
Weekly price and charts BiodesixInc Strong weekly Stock price targets for BiodesixInc BDSX are 0.29 and 0.34 | Weekly Target 1 | 0.25 | | Weekly Target 2 | 0.28 | | Weekly Target 3 | 0.3 | | Weekly Target 4 | 0.33 | | Weekly Target 5 | 0.35 |
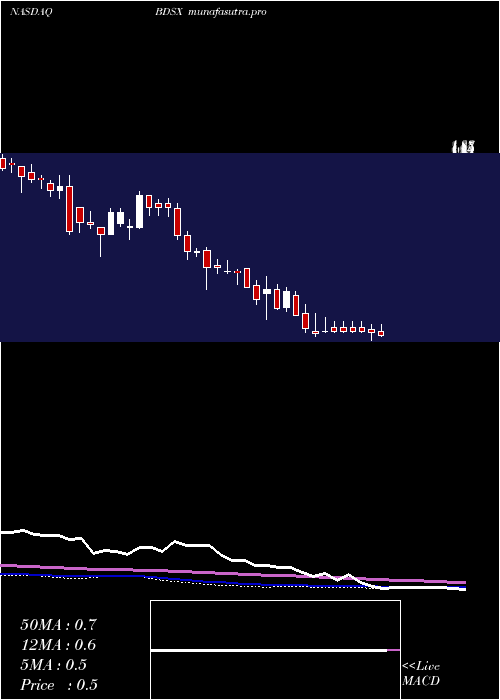
Weekly price and volumes for Biodesix Inc
| Date |
Closing |
Open |
Range |
Volume |
Fri 11 July 2025 |
0.31 (14.81%) |
0.27 |
0.27 - 0.32 |
0.0733 times |
Thu 03 July 2025 |
0.27 (8%) |
0.27 |
0.26 - 0.31 |
0.0786 times |
Fri 27 June 2025 |
0.25 (-3.85%) |
0.26 |
0.25 - 0.28 |
0.0873 times |
Fri 20 June 2025 |
0.26 (-10.34%) |
0.29 |
0.26 - 0.30 |
0.075 times |
Fri 13 June 2025 |
0.29 (-3.33%) |
0.29 |
0.28 - 0.33 |
0.306 times |
Fri 06 June 2025 |
0.30 (0%) |
0.30 |
0.27 - 0.33 |
0.1571 times |
Fri 30 May 2025 |
0.30 (-11.76%) |
0.35 |
0.29 - 0.37 |
0.1944 times |
Fri 23 May 2025 |
0.34 (13.33%) |
0.30 |
0.25 - 0.51 |
7.6204 times |
Fri 16 May 2025 |
0.30 (-18.92%) |
0.42 |
0.17 - 0.42 |
1.2794 times |
Fri 09 May 2025 |
0.37 (-28.85%) |
0.53 |
0.34 - 0.53 |
0.1283 times |
Fri 02 May 2025 |
0.52 (-3.7%) |
0.55 |
0.51 - 0.60 |
0.0165 times |
Monthly price and charts BiodesixInc Strong monthly Stock price targets for BiodesixInc BDSX are 0.29 and 0.34 | Monthly Target 1 | 0.25 | | Monthly Target 2 | 0.28 | | Monthly Target 3 | 0.3 | | Monthly Target 4 | 0.33 | | Monthly Target 5 | 0.35 |
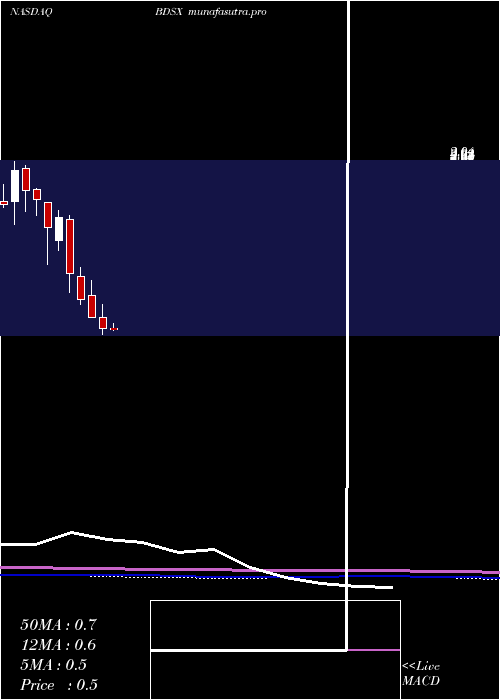
Monthly price and volumes Biodesix Inc
| Date |
Closing |
Open |
Range |
Volume |
Fri 11 July 2025 |
0.31 (10.71%) |
0.28 |
0.27 - 0.32 |
0.1089 times |
Mon 30 June 2025 |
0.28 (-6.67%) |
0.30 |
0.25 - 0.33 |
0.5937 times |
Fri 30 May 2025 |
0.30 (-43.4%) |
0.53 |
0.17 - 0.58 |
8.3409 times |
Wed 30 April 2025 |
0.53 (-15.87%) |
0.63 |
0.48 - 0.75 |
0.1262 times |
Mon 31 March 2025 |
0.63 (-20.25%) |
0.83 |
0.63 - 0.96 |
0.1685 times |
Fri 28 February 2025 |
0.79 (-23.3%) |
1.00 |
0.75 - 1.08 |
0.0859 times |
Fri 31 January 2025 |
1.03 (-32.68%) |
1.52 |
0.86 - 1.55 |
0.1715 times |
Tue 31 December 2024 |
1.53 (6.25%) |
1.33 |
1.24 - 1.60 |
0.0637 times |
Tue 26 November 2024 |
1.44 (-15.29%) |
1.67 |
1.11 - 1.67 |
0.2828 times |
Thu 31 October 2024 |
1.70 (-4.49%) |
1.79 |
1.55 - 1.80 |
0.0579 times |
Mon 30 September 2024 |
1.78 (-9.18%) |
1.98 |
1.59 - 2.00 |
0.0726 times |
DMA SMA EMA moving averages of Biodesix Inc BDSX
DMA (daily moving average) of Biodesix Inc BDSX
| DMA period | DMA value | | 5 day DMA | 0.3 | | 12 day DMA | 0.29 | | 20 day DMA | 0.29 | | 35 day DMA | 0.3 | | 50 day DMA | 0.33 | | 100 day DMA | 0.51 | | 150 day DMA | 0.75 | | 200 day DMA | 0.95 | EMA (exponential moving average) of Biodesix Inc BDSX
| EMA period | EMA current | EMA prev | EMA prev2 | | 5 day EMA | 0.3 | 0.3 | 0.29 | | 12 day EMA | 0.29 | 0.29 | 0.29 | | 20 day EMA | 0.31 | 0.31 | 0.31 | | 35 day EMA | 0.34 | 0.34 | 0.34 | | 50 day EMA | 0.35 | 0.35 | 0.35 |
SMA (simple moving average) of Biodesix Inc BDSX
| SMA period | SMA current | SMA prev | SMA prev2 | | 5 day SMA | 0.3 | 0.29 | 0.29 | | 12 day SMA | 0.29 | 0.28 | 0.28 | | 20 day SMA | 0.29 | 0.29 | 0.29 | | 35 day SMA | 0.3 | 0.3 | 0.3 | | 50 day SMA | 0.33 | 0.33 | 0.34 | | 100 day SMA | 0.51 | 0.52 | 0.53 | | 150 day SMA | 0.75 | 0.76 | 0.77 | | 200 day SMA | 0.95 | 0.96 | 0.97 |
|
|
