BcbBancorp BCBP full analysis,charts,indicators,moving averages,SMA,DMA,EMA,ADX,MACD,RSIBcb Bancorp BCBP WideScreen charts, DMA,SMA,EMA technical analysis, forecast prediction, by indicators ADX,MACD,RSI,CCI NASDAQ stock exchange
operates under Finance sector & deals in Savings Institutions
Daily price and charts and targets BcbBancorp Strong Daily Stock price targets for BcbBancorp BCBP are 8.9 and 9.1 | Daily Target 1 | 8.73 | | Daily Target 2 | 8.86 | | Daily Target 3 | 8.93 | | Daily Target 4 | 9.06 | | Daily Target 5 | 9.13 |
Daily price and volume Bcb Bancorp
| Date |
Closing |
Open |
Range |
Volume |
Mon 14 July 2025 |
8.99 (1.47%) |
8.87 |
8.80 - 9.00 |
0.5552 times |
Fri 11 July 2025 |
8.86 (-2.64%) |
9.03 |
8.85 - 9.03 |
0.6698 times |
Thu 10 July 2025 |
9.10 (-0.44%) |
9.10 |
9.05 - 9.22 |
0.6268 times |
Wed 09 July 2025 |
9.14 (-0.98%) |
9.23 |
9.07 - 9.36 |
0.9181 times |
Tue 08 July 2025 |
9.23 (0.65%) |
9.14 |
9.12 - 9.38 |
1.2751 times |
Mon 07 July 2025 |
9.17 (-0.65%) |
9.16 |
9.03 - 9.29 |
1.2763 times |
Thu 03 July 2025 |
9.23 (1.32%) |
9.10 |
9.00 - 9.24 |
0.9157 times |
Wed 02 July 2025 |
9.11 (3.17%) |
8.83 |
8.79 - 9.11 |
1.1103 times |
Tue 01 July 2025 |
8.83 (4.87%) |
8.44 |
8.33 - 8.83 |
1.3324 times |
Mon 30 June 2025 |
8.42 (-0.12%) |
8.41 |
8.33 - 8.48 |
1.3204 times |
Fri 27 June 2025 |
8.43 (1.08%) |
8.35 |
8.31 - 8.43 |
2.5107 times |
Weekly price and charts BcbBancorp Strong weekly Stock price targets for BcbBancorp BCBP are 8.9 and 9.1 | Weekly Target 1 | 8.73 | | Weekly Target 2 | 8.86 | | Weekly Target 3 | 8.93 | | Weekly Target 4 | 9.06 | | Weekly Target 5 | 9.13 |
Weekly price and volumes for Bcb Bancorp
| Date |
Closing |
Open |
Range |
Volume |
Mon 14 July 2025 |
8.99 (1.47%) |
8.87 |
8.80 - 9.00 |
0.1374 times |
Fri 11 July 2025 |
8.86 (-4.01%) |
9.16 |
8.85 - 9.38 |
1.1795 times |
Thu 03 July 2025 |
9.23 (9.49%) |
8.41 |
8.33 - 9.24 |
1.1579 times |
Fri 27 June 2025 |
8.43 (7.53%) |
7.84 |
7.83 - 8.43 |
1.7928 times |
Fri 20 June 2025 |
7.84 (1.82%) |
7.75 |
7.67 - 7.95 |
0.6949 times |
Fri 13 June 2025 |
7.70 (-3.39%) |
7.98 |
7.54 - 8.19 |
1.5201 times |
Fri 06 June 2025 |
7.97 (-1.6%) |
8.10 |
7.76 - 8.17 |
1.1177 times |
Fri 30 May 2025 |
8.10 (1.38%) |
8.06 |
8.01 - 8.24 |
0.6403 times |
Fri 23 May 2025 |
7.99 (-4.43%) |
8.33 |
7.92 - 8.52 |
0.9895 times |
Fri 16 May 2025 |
8.36 (0.72%) |
8.38 |
8.30 - 8.67 |
0.77 times |
Fri 09 May 2025 |
8.30 (-1.07%) |
8.38 |
8.11 - 8.58 |
1.173 times |

Monthly price and charts BcbBancorp Strong monthly Stock price targets for BcbBancorp BCBP are 8.66 and 9.71 | Monthly Target 1 | 7.85 | | Monthly Target 2 | 8.42 | | Monthly Target 3 | 8.9 | | Monthly Target 4 | 9.47 | | Monthly Target 5 | 9.95 |
Monthly price and volumes Bcb Bancorp
| Date |
Closing |
Open |
Range |
Volume |
Mon 14 July 2025 |
8.99 (6.77%) |
8.44 |
8.33 - 9.38 |
0.6524 times |
Mon 30 June 2025 |
8.42 (3.95%) |
8.10 |
7.54 - 8.48 |
1.6559 times |
Fri 30 May 2025 |
8.10 (-1.46%) |
8.17 |
7.92 - 8.67 |
1.2067 times |
Wed 30 April 2025 |
8.22 (-16.63%) |
9.77 |
8.07 - 10.05 |
1.3113 times |
Mon 31 March 2025 |
9.86 (-2.67%) |
10.08 |
9.37 - 10.38 |
0.9107 times |
Fri 28 February 2025 |
10.13 (-6.46%) |
10.55 |
9.90 - 11.07 |
0.8223 times |
Fri 31 January 2025 |
10.83 (-8.3%) |
11.84 |
10.55 - 12.26 |
1.1829 times |
Tue 31 December 2024 |
11.81 (-11.93%) |
12.95 |
11.49 - 13.17 |
0.7897 times |
Tue 26 November 2024 |
13.41 (10.46%) |
11.91 |
11.79 - 14.04 |
0.7342 times |
Thu 31 October 2024 |
12.14 (-1.62%) |
12.12 |
11.62 - 13.67 |
0.7337 times |
Mon 30 September 2024 |
12.34 (-0.56%) |
12.32 |
11.63 - 12.90 |
0.7715 times |

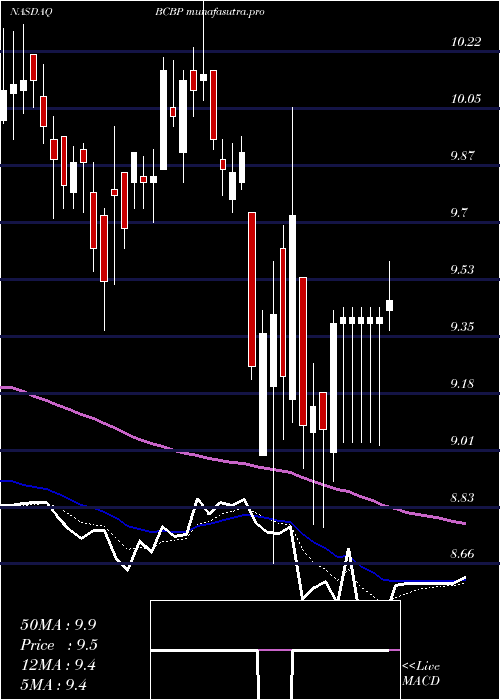
DMA SMA EMA moving averages of Bcb Bancorp BCBP
DMA (daily moving average) of Bcb Bancorp BCBP
| DMA period | DMA value | | 5 day DMA | 9.06 | | 12 day DMA | 8.9 | | 20 day DMA | 8.51 | | 35 day DMA | 8.3 | | 50 day DMA | 8.32 | | 100 day DMA | 8.97 | | 150 day DMA | 9.82 | | 200 day DMA | 10.5 | EMA (exponential moving average) of Bcb Bancorp BCBP
| EMA period | EMA current | EMA prev | EMA prev2 | | 5 day EMA | 9 | 9.01 | 9.09 | | 12 day EMA | 8.85 | 8.83 | 8.83 | | 20 day EMA | 8.69 | 8.66 | 8.64 | | 35 day EMA | 8.55 | 8.52 | 8.5 | | 50 day EMA | 8.41 | 8.39 | 8.37 |
SMA (simple moving average) of Bcb Bancorp BCBP
| SMA period | SMA current | SMA prev | SMA prev2 | | 5 day SMA | 9.06 | 9.1 | 9.17 | | 12 day SMA | 8.9 | 8.84 | 8.79 | | 20 day SMA | 8.51 | 8.46 | 8.42 | | 35 day SMA | 8.3 | 8.28 | 8.27 | | 50 day SMA | 8.32 | 8.31 | 8.3 | | 100 day SMA | 8.97 | 8.98 | 9 | | 150 day SMA | 9.82 | 9.85 | 9.89 | | 200 day SMA | 10.5 | 10.52 | 10.54 |
|
|
