BarrettBusiness BBSI full analysis,charts,indicators,moving averages,SMA,DMA,EMA,ADX,MACD,RSIBarrett Business BBSI WideScreen charts, DMA,SMA,EMA technical analysis, forecast prediction, by indicators ADX,MACD,RSI,CCI NASDAQ stock exchange
operates under Technology sector & deals in Professional Services
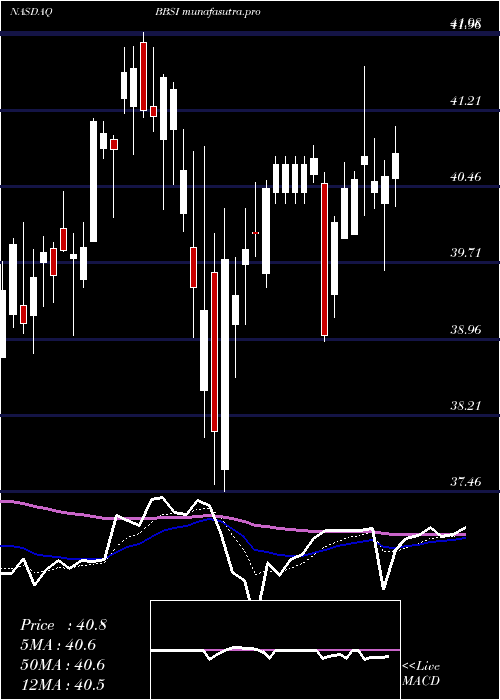
Daily price and charts and targets BarrettBusiness Strong Daily Stock price targets for BarrettBusiness BBSI are 34.1 and 34.84 | Daily Target 1 | 33.96 | | Daily Target 2 | 34.24 | | Daily Target 3 | 34.696666666667 | | Daily Target 4 | 34.98 | | Daily Target 5 | 35.44 |
Daily price and volume Barrett Business
| Date |
Closing |
Open |
Range |
Volume |
Fri 05 December 2025 |
34.53 (-1.09%) |
34.88 |
34.41 - 35.15 |
0.5957 times |
Thu 04 December 2025 |
34.91 (-1.61%) |
35.56 |
34.79 - 35.76 |
0.6746 times |
Wed 03 December 2025 |
35.48 (1.28%) |
35.10 |
35.08 - 35.66 |
0.9976 times |
Tue 02 December 2025 |
35.03 (1.01%) |
34.83 |
34.52 - 35.19 |
0.6992 times |
Mon 01 December 2025 |
34.68 (-1.17%) |
34.69 |
34.47 - 35.32 |
1.4389 times |
Fri 28 November 2025 |
35.09 (-0.62%) |
35.20 |
34.99 - 35.62 |
0.4122 times |
Wed 26 November 2025 |
35.31 (-0.48%) |
35.28 |
34.91 - 35.65 |
0.8158 times |
Tue 25 November 2025 |
35.48 (1.52%) |
35.17 |
35.17 - 36.03 |
1.3023 times |
Mon 24 November 2025 |
34.95 (0.26%) |
34.79 |
34.29 - 35.17 |
1.1302 times |
Fri 21 November 2025 |
34.86 (1.87%) |
34.21 |
34.21 - 35.23 |
1.9335 times |
Thu 20 November 2025 |
34.22 (-1.72%) |
35.31 |
34.09 - 35.73 |
2.1576 times |
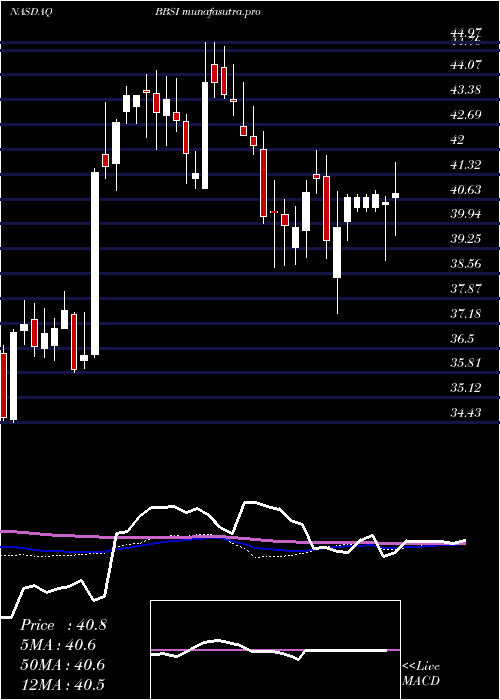
Weekly price and charts BarrettBusiness Strong weekly Stock price targets for BarrettBusiness BBSI are 33.8 and 35.15 | Weekly Target 1 | 33.55 | | Weekly Target 2 | 34.04 | | Weekly Target 3 | 34.9 | | Weekly Target 4 | 35.39 | | Weekly Target 5 | 36.25 |
Weekly price and volumes for Barrett Business
| Date |
Closing |
Open |
Range |
Volume |
Fri 05 December 2025 |
34.53 (-1.6%) |
34.69 |
34.41 - 35.76 |
0.7869 times |
Fri 28 November 2025 |
35.09 (0.66%) |
34.79 |
34.29 - 36.03 |
0.6538 times |
Fri 21 November 2025 |
34.86 (-2.08%) |
35.39 |
34.09 - 37.28 |
1.5352 times |
Fri 14 November 2025 |
35.60 (6.87%) |
33.66 |
33.60 - 35.66 |
1.4016 times |
Fri 07 November 2025 |
33.31 (-17.69%) |
40.48 |
33.01 - 40.89 |
1.7553 times |
Fri 31 October 2025 |
40.47 (0%) |
40.15 |
39.81 - 41.19 |
0.2731 times |
Fri 31 October 2025 |
40.47 (-3.64%) |
42.06 |
39.81 - 42.10 |
0.9941 times |
Fri 24 October 2025 |
42.00 (0.91%) |
41.52 |
41.25 - 42.47 |
1.0785 times |
Fri 17 October 2025 |
41.62 (-2.48%) |
43.00 |
41.45 - 43.53 |
0.7489 times |
Fri 10 October 2025 |
42.68 (-5.58%) |
45.34 |
42.63 - 45.53 |
0.7726 times |
Fri 03 October 2025 |
45.20 (1.05%) |
44.73 |
43.35 - 45.41 |
0.5626 times |
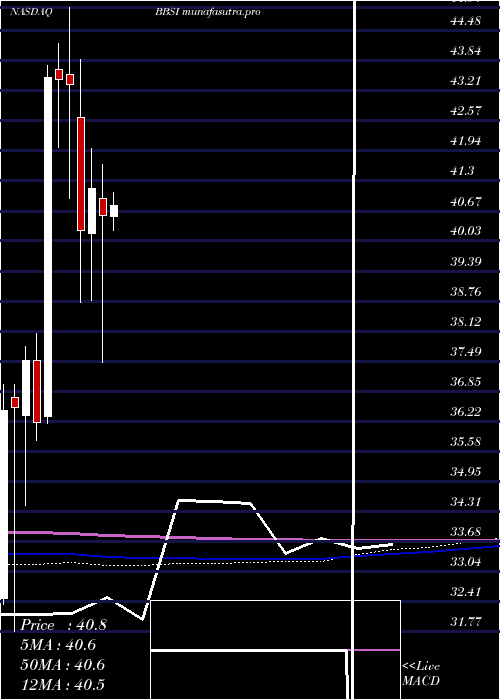
Monthly price and charts BarrettBusiness Strong monthly Stock price targets for BarrettBusiness BBSI are 33.8 and 35.15 | Monthly Target 1 | 33.55 | | Monthly Target 2 | 34.04 | | Monthly Target 3 | 34.9 | | Monthly Target 4 | 35.39 | | Monthly Target 5 | 36.25 |
Monthly price and volumes Barrett Business
| Date |
Closing |
Open |
Range |
Volume |
Fri 05 December 2025 |
34.53 (-1.6%) |
34.69 |
34.41 - 35.76 |
0.2353 times |
Fri 28 November 2025 |
35.09 (-13.29%) |
40.48 |
33.01 - 40.89 |
1.5988 times |
Fri 31 October 2025 |
40.47 (-8.69%) |
44.02 |
39.81 - 45.53 |
1.2432 times |
Tue 30 September 2025 |
44.32 (-9.18%) |
48.26 |
43.69 - 49.65 |
0.9803 times |
Fri 29 August 2025 |
48.80 (6.16%) |
45.55 |
43.87 - 49.63 |
1.1405 times |
Thu 31 July 2025 |
45.97 (10.27%) |
41.46 |
41.36 - 46.90 |
1.0286 times |
Mon 30 June 2025 |
41.69 (0.87%) |
41.25 |
40.81 - 42.56 |
0.8895 times |
Fri 30 May 2025 |
41.33 (1.9%) |
40.54 |
39.50 - 42.99 |
0.9956 times |
Wed 30 April 2025 |
40.56 (-1.43%) |
40.92 |
37.46 - 41.64 |
1.0565 times |
Mon 31 March 2025 |
41.15 (2.24%) |
40.20 |
38.78 - 41.98 |
0.8315 times |
Fri 28 February 2025 |
40.25 (-7.11%) |
42.64 |
38.72 - 43.87 |
0.7276 times |
DMA SMA EMA moving averages of Barrett Business BBSI
DMA (daily moving average) of Barrett Business BBSI
| DMA period | DMA value | | 5 day DMA | 34.93 | | 12 day DMA | 34.95 | | 20 day DMA | 34.93 | | 35 day DMA | 37.41 | | 50 day DMA | 39.35 | | 100 day DMA | 42.96 | | 150 day DMA | 42.62 | | 200 day DMA | 42.03 | EMA (exponential moving average) of Barrett Business BBSI
| EMA period | EMA current | EMA prev | EMA prev2 | | 5 day EMA | 34.9 | 35.08 | 35.16 | | 12 day EMA | 35.15 | 35.26 | 35.32 | | 20 day EMA | 35.8 | 35.93 | 36.04 | | 35 day EMA | 37.43 | 37.6 | 37.76 | | 50 day EMA | 39.4 | 39.6 | 39.79 |
SMA (simple moving average) of Barrett Business BBSI
| SMA period | SMA current | SMA prev | SMA prev2 | | 5 day SMA | 34.93 | 35.04 | 35.12 | | 12 day SMA | 34.95 | 35.05 | 35.06 | | 20 day SMA | 34.93 | 34.95 | 35.24 | | 35 day SMA | 37.41 | 37.63 | 37.86 | | 50 day SMA | 39.35 | 39.54 | 39.74 | | 100 day SMA | 42.96 | 43.05 | 43.13 | | 150 day SMA | 42.62 | 42.66 | 42.7 | | 200 day SMA | 42.03 | 42.06 | 42.09 |
|
|
