BroadcomInc AVGO full analysis,charts,indicators,moving averages,SMA,DMA,EMA,ADX,MACD,RSIBroadcom Inc AVGO WideScreen charts, DMA,SMA,EMA technical analysis, forecast prediction, by indicators ADX,MACD,RSI,CCI NASDAQ stock exchange
operates under Technology sector & deals in Semiconductors
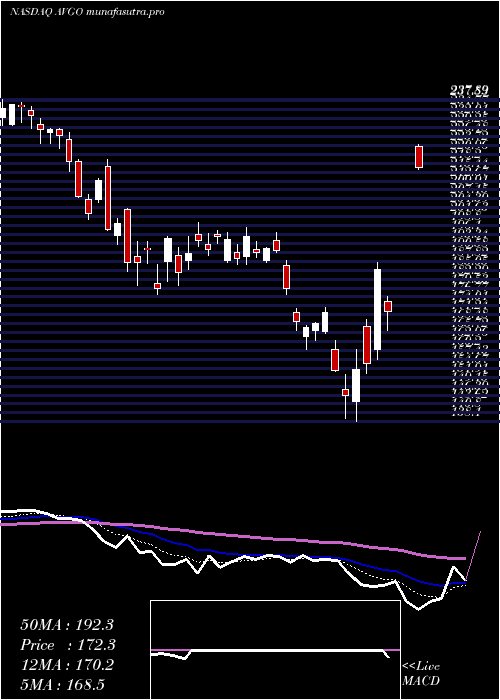
Daily price and charts and targets BroadcomInc Strong Daily Stock price targets for BroadcomInc AVGO are 340.94 and 349.99 | Daily Target 1 | 333.76 | | Daily Target 2 | 339.06 | | Daily Target 3 | 342.81333333333 | | Daily Target 4 | 348.11 | | Daily Target 5 | 351.86 |
Daily price and volume Broadcom Inc
| Date |
Closing |
Open |
Range |
Volume |
Thu 23 October 2025 |
344.35 (1.12%) |
342.00 |
337.52 - 346.57 |
0.263 times |
Wed 22 October 2025 |
340.53 (-0.62%) |
346.98 |
335.51 - 349.00 |
0.4088 times |
Tue 21 October 2025 |
342.66 (-1.86%) |
350.00 |
341.31 - 351.10 |
0.8749 times |
Mon 20 October 2025 |
349.16 (-0.24%) |
351.98 |
347.84 - 356.59 |
0.369 times |
Fri 17 October 2025 |
349.99 (-0.68%) |
346.05 |
340.78 - 353.09 |
0.7162 times |
Thu 16 October 2025 |
352.38 (0.3%) |
356.00 |
349.49 - 363.24 |
0.7942 times |
Wed 15 October 2025 |
351.33 (2.09%) |
354.47 |
347.50 - 359.40 |
1.3003 times |
Tue 14 October 2025 |
344.13 (-3.52%) |
350.13 |
339.65 - 350.67 |
1.2003 times |
Mon 13 October 2025 |
356.70 (9.88%) |
352.77 |
343.52 - 359.38 |
2.4999 times |
Fri 10 October 2025 |
324.63 (-5.91%) |
345.39 |
324.05 - 350.60 |
1.5734 times |
Thu 09 October 2025 |
345.02 (-0.14%) |
345.75 |
340.40 - 347.31 |
0.9592 times |
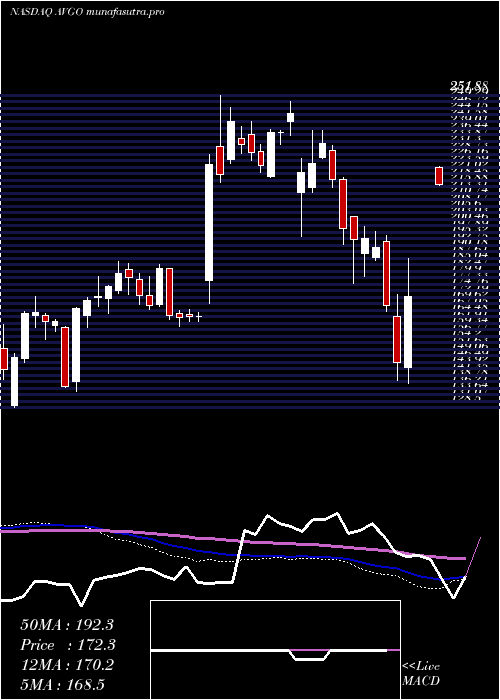
Weekly price and charts BroadcomInc Strong weekly Stock price targets for BroadcomInc AVGO are 329.39 and 350.47 | Weekly Target 1 | 324.4 | | Weekly Target 2 | 334.38 | | Weekly Target 3 | 345.48333333333 | | Weekly Target 4 | 355.46 | | Weekly Target 5 | 366.56 |
Weekly price and volumes for Broadcom Inc
| Date |
Closing |
Open |
Range |
Volume |
Thu 23 October 2025 |
344.35 (-1.61%) |
351.98 |
335.51 - 356.59 |
0.3386 times |
Fri 17 October 2025 |
349.99 (7.81%) |
352.77 |
339.65 - 363.24 |
1.1508 times |
Fri 10 October 2025 |
324.63 (-3.88%) |
340.49 |
324.05 - 350.60 |
0.9456 times |
Fri 03 October 2025 |
337.75 (0.96%) |
336.00 |
324.50 - 347.61 |
0.8167 times |
Fri 26 September 2025 |
334.53 (-3.02%) |
342.42 |
327.30 - 346.67 |
1.0318 times |
Fri 19 September 2025 |
344.94 (-4.15%) |
359.87 |
336.43 - 365.69 |
1.4177 times |
Fri 12 September 2025 |
359.87 (7.46%) |
342.75 |
335.83 - 374.23 |
1.7572 times |
Fri 05 September 2025 |
334.89 (12.61%) |
289.34 |
287.17 - 356.34 |
1.42 times |
Fri 29 August 2025 |
297.39 (0%) |
307.01 |
293.66 - 307.01 |
0.2076 times |
Fri 29 August 2025 |
297.39 (1.15%) |
292.81 |
291.71 - 311.00 |
0.9141 times |
Fri 22 August 2025 |
294.00 (-4.03%) |
302.70 |
281.87 - 306.17 |
0.8618 times |
Monthly price and charts BroadcomInc Strong monthly Stock price targets for BroadcomInc AVGO are 334.2 and 373.39 | Monthly Target 1 | 304.69 | | Monthly Target 2 | 324.52 | | Monthly Target 3 | 343.88 | | Monthly Target 4 | 363.71 | | Monthly Target 5 | 383.07 |
Monthly price and volumes Broadcom Inc
| Date |
Closing |
Open |
Range |
Volume |
Thu 23 October 2025 |
344.35 (4.38%) |
328.14 |
324.05 - 363.24 |
0.5832 times |
Tue 30 September 2025 |
329.91 (10.94%) |
289.34 |
287.17 - 374.23 |
1.2313 times |
Fri 29 August 2025 |
297.39 (1.26%) |
286.54 |
281.61 - 317.35 |
0.743 times |
Thu 31 July 2025 |
293.70 (6.55%) |
274.40 |
262.66 - 306.95 |
0.7323 times |
Mon 30 June 2025 |
275.65 (13.87%) |
243.25 |
241.11 - 277.70 |
1.0234 times |
Fri 30 May 2025 |
242.07 (25.77%) |
198.14 |
195.94 - 246.07 |
0.7889 times |
Wed 30 April 2025 |
192.47 (14.96%) |
166.37 |
138.10 - 193.37 |
1.3014 times |
Mon 31 March 2025 |
167.43 (-16.05%) |
204.00 |
160.62 - 204.06 |
1.3555 times |
Fri 28 February 2025 |
199.43 (-9.87%) |
215.46 |
193.15 - 237.93 |
0.8951 times |
Fri 31 January 2025 |
221.27 (-4.44%) |
236.15 |
196.23 - 249.59 |
1.3459 times |
Tue 31 December 2024 |
231.54 (40.55%) |
178.95 |
169.73 - 251.88 |
1.5566 times |
DMA SMA EMA moving averages of Broadcom Inc AVGO
DMA (daily moving average) of Broadcom Inc AVGO
| DMA period | DMA value | | 5 day DMA | 345.34 | | 12 day DMA | 345.53 | | 20 day DMA | 341.05 | | 35 day DMA | 344.03 | | 50 day DMA | 330.51 | | 100 day DMA | 303.3 | | 150 day DMA | 267.4 | | 200 day DMA | 254.48 | EMA (exponential moving average) of Broadcom Inc AVGO
| EMA period | EMA current | EMA prev | EMA prev2 | | 5 day EMA | 344.58 | 344.7 | 346.79 | | 12 day EMA | 344.31 | 344.3 | 344.99 | | 20 day EMA | 342.52 | 342.33 | 342.52 | | 35 day EMA | 335.85 | 335.35 | 335.04 | | 50 day EMA | 330.14 | 329.56 | 329.11 |
SMA (simple moving average) of Broadcom Inc AVGO
| SMA period | SMA current | SMA prev | SMA prev2 | | 5 day SMA | 345.34 | 346.94 | 349.1 | | 12 day SMA | 345.53 | 344.87 | 344.4 | | 20 day SMA | 341.05 | 340.64 | 340.58 | | 35 day SMA | 344.03 | 342.93 | 341.84 | | 50 day SMA | 330.51 | 329.85 | 329.22 | | 100 day SMA | 303.3 | 302.28 | 301.3 | | 150 day SMA | 267.4 | 266.41 | 265.39 | | 200 day SMA | 254.48 | 253.9 | 253.38 |
|
|
