AtaraBiotherapeutics ATRA full analysis,charts,indicators,moving averages,SMA,DMA,EMA,ADX,MACD,RSIAtara Biotherapeutics ATRA WideScreen charts, DMA,SMA,EMA technical analysis, forecast prediction, by indicators ADX,MACD,RSI,CCI NASDAQ stock exchange
operates under Health Care sector & deals in Biotechnology Biological Products No Diagnostic Substances
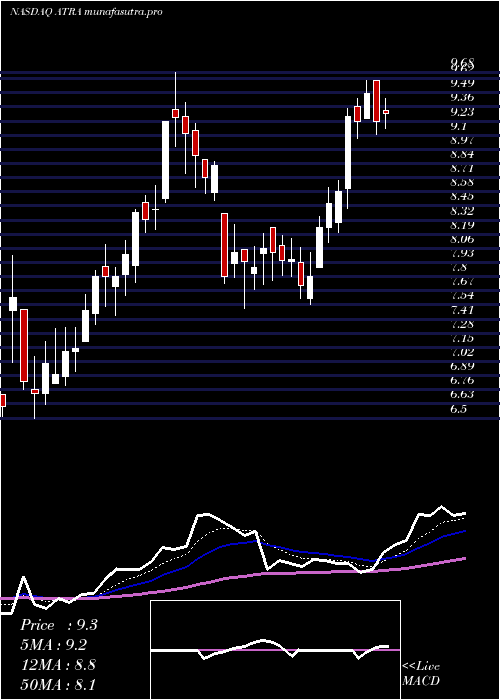
Daily price and charts and targets AtaraBiotherapeutics Strong Daily Stock price targets for AtaraBiotherapeutics ATRA are 11.25 and 12.46 | Daily Target 1 | 10.26 | | Daily Target 2 | 11.03 | | Daily Target 3 | 11.466666666667 | | Daily Target 4 | 12.24 | | Daily Target 5 | 12.68 |
Daily price and volume Atara Biotherapeutics
| Date |
Closing |
Open |
Range |
Volume |
Mon 28 July 2025 |
11.81 (1.99%) |
11.58 |
10.69 - 11.90 |
0.4539 times |
Fri 25 July 2025 |
11.58 (-5.31%) |
12.18 |
10.68 - 12.18 |
0.9755 times |
Thu 24 July 2025 |
12.23 (-0.24%) |
13.26 |
12.18 - 13.46 |
0.9712 times |
Wed 23 July 2025 |
12.26 (-5.84%) |
13.08 |
12.01 - 13.23 |
1.0669 times |
Tue 22 July 2025 |
13.02 (13.22%) |
11.58 |
11.58 - 13.21 |
1.6111 times |
Mon 21 July 2025 |
11.50 (15%) |
10.40 |
10.15 - 11.70 |
1.7068 times |
Fri 18 July 2025 |
10.00 (2.88%) |
9.80 |
9.78 - 10.99 |
1.2067 times |
Thu 17 July 2025 |
9.72 (4.74%) |
9.30 |
8.75 - 9.80 |
0.6914 times |
Wed 16 July 2025 |
9.28 (0.11%) |
9.20 |
8.82 - 9.29 |
0.4248 times |
Tue 15 July 2025 |
9.27 (-0.32%) |
9.29 |
8.77 - 9.62 |
0.8916 times |
Mon 14 July 2025 |
9.30 (0.76%) |
9.33 |
9.16 - 9.44 |
0.3248 times |
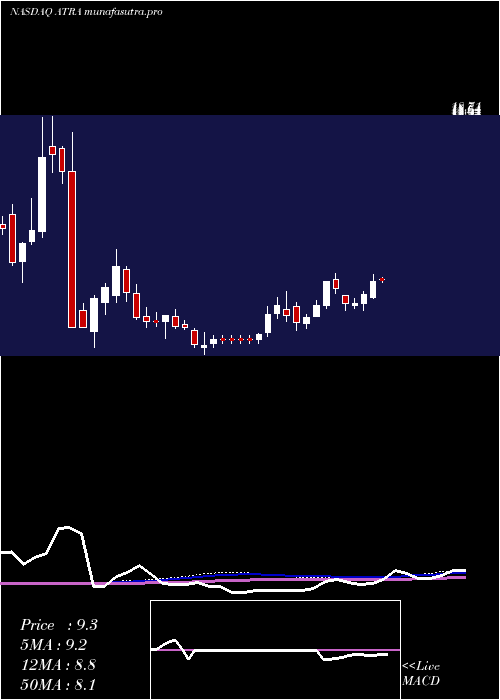
Weekly price and charts AtaraBiotherapeutics Strong weekly Stock price targets for AtaraBiotherapeutics ATRA are 11.25 and 12.46 | Weekly Target 1 | 10.26 | | Weekly Target 2 | 11.03 | | Weekly Target 3 | 11.466666666667 | | Weekly Target 4 | 12.24 | | Weekly Target 5 | 12.68 |
Weekly price and volumes for Atara Biotherapeutics
| Date |
Closing |
Open |
Range |
Volume |
Mon 28 July 2025 |
11.81 (1.99%) |
11.58 |
10.69 - 11.90 |
0.1775 times |
Fri 25 July 2025 |
11.58 (15.8%) |
10.40 |
10.15 - 13.46 |
2.4768 times |
Fri 18 July 2025 |
10.00 (8.34%) |
9.33 |
8.75 - 10.99 |
1.3845 times |
Fri 11 July 2025 |
9.23 (8.97%) |
8.30 |
8.21 - 9.60 |
0.7119 times |
Thu 03 July 2025 |
8.47 (6.41%) |
7.93 |
7.54 - 8.62 |
0.3736 times |
Fri 27 June 2025 |
7.96 (0.25%) |
7.83 |
7.68 - 8.25 |
0.4687 times |
Fri 20 June 2025 |
7.94 (-9.98%) |
8.38 |
7.51 - 8.38 |
0.8566 times |
Fri 13 June 2025 |
8.82 (-4.44%) |
9.34 |
8.50 - 9.68 |
1.0409 times |
Fri 06 June 2025 |
9.23 (18.33%) |
7.82 |
7.63 - 9.23 |
1.4809 times |
Fri 30 May 2025 |
7.80 (9.24%) |
7.20 |
7.20 - 8.10 |
1.0287 times |
Fri 23 May 2025 |
7.14 (4.39%) |
6.76 |
6.50 - 7.33 |
1.7536 times |
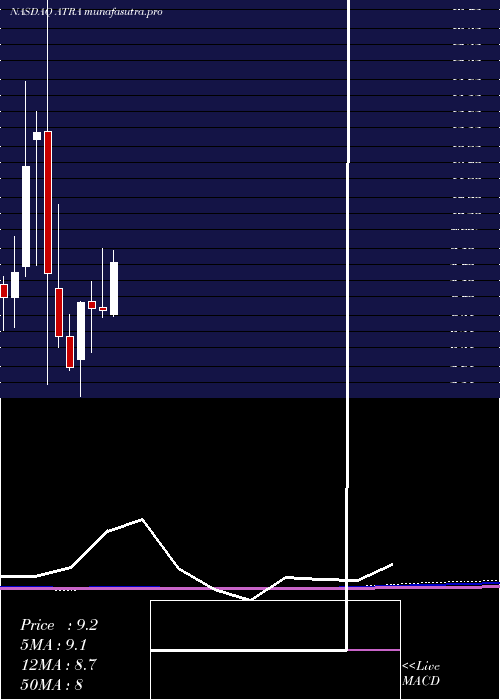
Monthly price and charts AtaraBiotherapeutics Strong monthly Stock price targets for AtaraBiotherapeutics ATRA are 9.68 and 15.6 | Monthly Target 1 | 5.02 | | Monthly Target 2 | 8.41 | | Monthly Target 3 | 10.936666666667 | | Monthly Target 4 | 14.33 | | Monthly Target 5 | 16.86 |
Monthly price and volumes Atara Biotherapeutics
| Date |
Closing |
Open |
Range |
Volume |
Mon 28 July 2025 |
11.81 (52.98%) |
7.60 |
7.54 - 13.46 |
0.5002 times |
Mon 30 June 2025 |
7.72 (-1.03%) |
7.82 |
7.51 - 9.68 |
0.3892 times |
Fri 30 May 2025 |
7.80 (-2.38%) |
8.01 |
6.39 - 8.65 |
0.6569 times |
Wed 30 April 2025 |
7.99 (34.51%) |
6.18 |
5.01 - 8.01 |
0.3993 times |
Mon 31 March 2025 |
5.94 (-14.04%) |
6.92 |
5.85 - 7.60 |
0.4574 times |
Fri 28 February 2025 |
6.91 (-22.18%) |
8.43 |
6.55 - 11.06 |
0.8268 times |
Fri 31 January 2025 |
8.88 (-33.28%) |
13.34 |
5.40 - 18.71 |
4.17 times |
Tue 31 December 2024 |
13.31 (8.56%) |
13.10 |
9.13 - 13.98 |
0.6086 times |
Tue 26 November 2024 |
12.26 (37.6%) |
9.10 |
8.80 - 14.93 |
1.1238 times |
Thu 31 October 2024 |
8.91 (9.59%) |
8.12 |
7.20 - 10.05 |
0.8679 times |
Mon 30 September 2024 |
8.13 (6.97%) |
7.50 |
6.81 - 10.69 |
1.9529 times |
DMA SMA EMA moving averages of Atara Biotherapeutics ATRA
DMA (daily moving average) of Atara Biotherapeutics ATRA
| DMA period | DMA value | | 5 day DMA | 12.18 | | 12 day DMA | 10.77 | | 20 day DMA | 9.9 | | 35 day DMA | 9.26 | | 50 day DMA | 8.71 | | 100 day DMA | 7.65 | | 150 day DMA | 8.44 | | 200 day DMA | 8.86 | EMA (exponential moving average) of Atara Biotherapeutics ATRA
| EMA period | EMA current | EMA prev | EMA prev2 | | 5 day EMA | 11.74 | 11.7 | 11.76 | | 12 day EMA | 10.99 | 10.84 | 10.7 | | 20 day EMA | 10.34 | 10.18 | 10.03 | | 35 day EMA | 9.55 | 9.42 | 9.29 | | 50 day EMA | 8.91 | 8.79 | 8.68 |
SMA (simple moving average) of Atara Biotherapeutics ATRA
| SMA period | SMA current | SMA prev | SMA prev2 | | 5 day SMA | 12.18 | 12.12 | 11.8 | | 12 day SMA | 10.77 | 10.57 | 10.38 | | 20 day SMA | 9.9 | 9.71 | 9.53 | | 35 day SMA | 9.26 | 9.16 | 9.07 | | 50 day SMA | 8.71 | 8.61 | 8.51 | | 100 day SMA | 7.65 | 7.6 | 7.56 | | 150 day SMA | 8.44 | 8.44 | 8.43 | | 200 day SMA | 8.86 | 8.84 | 8.82 |
|
|
