AppianCorporation APPN full analysis,charts,indicators,moving averages,SMA,DMA,EMA,ADX,MACD,RSIAppian Corporation APPN WideScreen charts, DMA,SMA,EMA technical analysis, forecast prediction, by indicators ADX,MACD,RSI,CCI NASDAQ stock exchange
operates under Technology sector & deals in Computer Software Prepackaged Software
Daily price and charts and targets AppianCorporation Strong Daily Stock price targets for AppianCorporation APPN are 27.88 and 29.48 | Daily Target 1 | 27.6 | | Daily Target 2 | 28.15 | | Daily Target 3 | 29.203333333333 | | Daily Target 4 | 29.75 | | Daily Target 5 | 30.8 |
Daily price and volume Appian Corporation
| Date |
Closing |
Open |
Range |
Volume |
Fri 11 July 2025 |
28.69 (-5.97%) |
30.24 |
28.66 - 30.26 |
0.8764 times |
Thu 10 July 2025 |
30.51 (-2.27%) |
31.08 |
30.00 - 31.11 |
0.7639 times |
Wed 09 July 2025 |
31.22 (-0.26%) |
31.32 |
30.77 - 31.36 |
1.0352 times |
Tue 08 July 2025 |
31.30 (0.32%) |
31.27 |
30.90 - 31.58 |
0.6779 times |
Mon 07 July 2025 |
31.20 (2.36%) |
30.24 |
30.05 - 31.29 |
1.1273 times |
Thu 03 July 2025 |
30.48 (1.13%) |
30.28 |
30.07 - 30.91 |
0.366 times |
Wed 02 July 2025 |
30.14 (-1.05%) |
30.39 |
29.82 - 30.69 |
1.3124 times |
Tue 01 July 2025 |
30.46 (2.01%) |
29.72 |
29.47 - 30.80 |
1.5273 times |
Mon 30 June 2025 |
29.86 (2.97%) |
29.13 |
28.98 - 30.24 |
1.3419 times |
Fri 27 June 2025 |
29.00 (2.22%) |
28.47 |
28.26 - 29.05 |
0.9716 times |
Thu 26 June 2025 |
28.37 (0.75%) |
28.20 |
27.86 - 28.69 |
0.6932 times |
Weekly price and charts AppianCorporation Strong weekly Stock price targets for AppianCorporation APPN are 27.22 and 30.14 | Weekly Target 1 | 26.72 | | Weekly Target 2 | 27.71 | | Weekly Target 3 | 29.643333333333 | | Weekly Target 4 | 30.63 | | Weekly Target 5 | 32.56 |
Weekly price and volumes for Appian Corporation
| Date |
Closing |
Open |
Range |
Volume |
Fri 11 July 2025 |
28.69 (-5.87%) |
30.24 |
28.66 - 31.58 |
1.1371 times |
Thu 03 July 2025 |
30.48 (5.1%) |
29.13 |
28.98 - 30.91 |
1.1541 times |
Fri 27 June 2025 |
29.00 (2.84%) |
28.01 |
27.35 - 29.18 |
1.1391 times |
Fri 20 June 2025 |
28.20 (-4.28%) |
30.01 |
27.63 - 30.69 |
0.5764 times |
Fri 13 June 2025 |
29.46 (-8.45%) |
32.17 |
29.24 - 32.34 |
0.7779 times |
Fri 06 June 2025 |
32.18 (2.16%) |
31.31 |
30.96 - 32.73 |
1.0366 times |
Fri 30 May 2025 |
31.50 (2.57%) |
31.36 |
30.90 - 31.83 |
0.7594 times |
Fri 23 May 2025 |
30.71 (-5.62%) |
31.96 |
30.59 - 32.66 |
0.8524 times |
Fri 16 May 2025 |
32.54 (2.68%) |
32.46 |
31.68 - 33.60 |
1.1773 times |
Fri 09 May 2025 |
31.69 (1.34%) |
30.98 |
29.97 - 33.43 |
1.3896 times |
Fri 02 May 2025 |
31.27 (-0.16%) |
31.33 |
30.03 - 31.75 |
0.8017 times |

Monthly price and charts AppianCorporation Strong monthly Stock price targets for AppianCorporation APPN are 27.22 and 30.14 | Monthly Target 1 | 26.72 | | Monthly Target 2 | 27.71 | | Monthly Target 3 | 29.643333333333 | | Monthly Target 4 | 30.63 | | Monthly Target 5 | 32.56 |
Monthly price and volumes Appian Corporation
| Date |
Closing |
Open |
Range |
Volume |
Fri 11 July 2025 |
28.69 (-3.92%) |
29.72 |
28.66 - 31.58 |
0.5556 times |
Mon 30 June 2025 |
29.86 (-5.21%) |
31.31 |
27.35 - 32.73 |
1.1024 times |
Fri 30 May 2025 |
31.50 (1.45%) |
31.56 |
29.97 - 33.60 |
1.2849 times |
Wed 30 April 2025 |
31.05 (7.78%) |
28.63 |
24.00 - 31.68 |
1.2095 times |
Mon 31 March 2025 |
28.81 (-11.27%) |
32.64 |
28.02 - 32.73 |
1.1867 times |
Fri 28 February 2025 |
32.47 (-7.47%) |
33.78 |
30.79 - 41.05 |
1.0518 times |
Fri 31 January 2025 |
35.09 (6.4%) |
33.43 |
32.04 - 37.46 |
0.8364 times |
Tue 31 December 2024 |
32.98 (-12.45%) |
40.46 |
32.21 - 41.30 |
0.5072 times |
Tue 26 November 2024 |
37.67 (5.37%) |
35.82 |
35.44 - 43.33 |
1.1148 times |
Thu 31 October 2024 |
35.75 (4.72%) |
34.11 |
30.38 - 35.98 |
1.1509 times |
Mon 30 September 2024 |
34.14 (5.24%) |
31.92 |
29.86 - 35.99 |
0.6956 times |

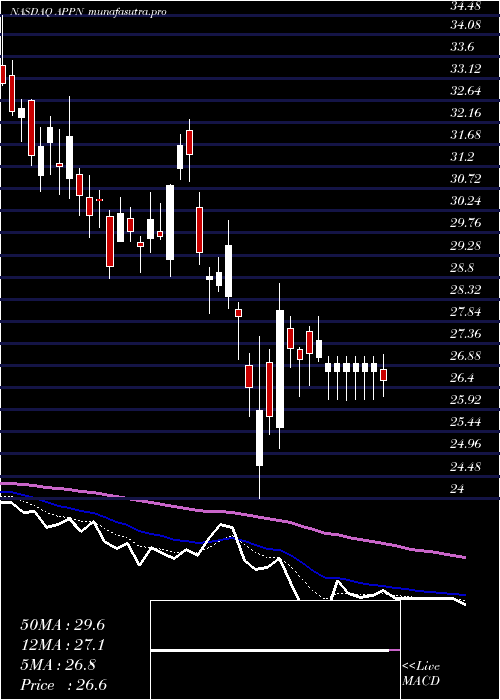
DMA SMA EMA moving averages of Appian Corporation APPN
DMA (daily moving average) of Appian Corporation APPN
| DMA period | DMA value | | 5 day DMA | 30.58 | | 12 day DMA | 29.95 | | 20 day DMA | 29.79 | | 35 day DMA | 30.54 | | 50 day DMA | 30.91 | | 100 day DMA | 30.3 | | 150 day DMA | 31.74 | | 200 day DMA | 32.52 | EMA (exponential moving average) of Appian Corporation APPN
| EMA period | EMA current | EMA prev | EMA prev2 | | 5 day EMA | 30.06 | 30.75 | 30.87 | | 12 day EMA | 30.13 | 30.39 | 30.37 | | 20 day EMA | 30.17 | 30.33 | 30.31 | | 35 day EMA | 30.33 | 30.43 | 30.42 | | 50 day EMA | 30.73 | 30.81 | 30.82 |
SMA (simple moving average) of Appian Corporation APPN
| SMA period | SMA current | SMA prev | SMA prev2 | | 5 day SMA | 30.58 | 30.94 | 30.87 | | 12 day SMA | 29.95 | 29.96 | 29.76 | | 20 day SMA | 29.79 | 29.93 | 30 | | 35 day SMA | 30.54 | 30.64 | 30.7 | | 50 day SMA | 30.91 | 30.95 | 30.97 | | 100 day SMA | 30.3 | 30.33 | 30.34 | | 150 day SMA | 31.74 | 31.8 | 31.85 | | 200 day SMA | 32.52 | 32.55 | 32.56 |
|
|
