AngiodynamicsInc ANGO full analysis,charts,indicators,moving averages,SMA,DMA,EMA,ADX,MACD,RSIAngiodynamics Inc ANGO WideScreen charts, DMA,SMA,EMA technical analysis, forecast prediction, by indicators ADX,MACD,RSI,CCI NASDAQ stock exchange
operates under Health Care sector & deals in Medical Dental Instruments
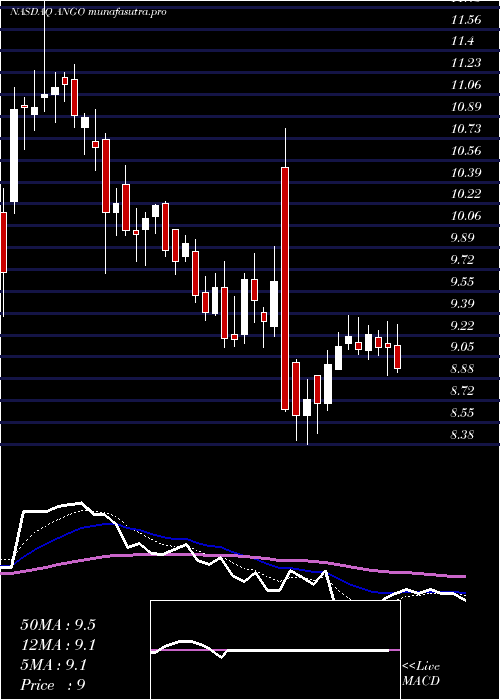
Daily price and charts and targets AngiodynamicsInc Strong Daily Stock price targets for AngiodynamicsInc ANGO are 9.07 and 9.38 | Daily Target 1 | 8.98 | | Daily Target 2 | 9.15 | | Daily Target 3 | 9.29 | | Daily Target 4 | 9.46 | | Daily Target 5 | 9.6 |
Daily price and volume Angiodynamics Inc
| Date |
Closing |
Open |
Range |
Volume |
Fri 11 July 2025 |
9.32 (-1.69%) |
9.39 |
9.12 - 9.43 |
0.7383 times |
Thu 10 July 2025 |
9.48 (-1.66%) |
9.64 |
9.31 - 9.84 |
1.2685 times |
Wed 09 July 2025 |
9.64 (5.01%) |
9.22 |
9.15 - 9.69 |
0.9285 times |
Tue 08 July 2025 |
9.18 (-0.11%) |
9.22 |
9.13 - 9.51 |
0.7017 times |
Mon 07 July 2025 |
9.19 (-4.07%) |
9.58 |
9.12 - 9.78 |
0.9291 times |
Thu 03 July 2025 |
9.58 (2.02%) |
9.38 |
9.37 - 9.69 |
0.5191 times |
Wed 02 July 2025 |
9.39 (-1.37%) |
9.54 |
9.33 - 9.67 |
1.0583 times |
Tue 01 July 2025 |
9.52 (-4.03%) |
9.86 |
9.47 - 9.95 |
1.02 times |
Mon 30 June 2025 |
9.92 (1.43%) |
9.82 |
9.78 - 9.98 |
0.6349 times |
Fri 27 June 2025 |
9.78 (-0.91%) |
10.03 |
9.68 - 10.03 |
2.2015 times |
Thu 26 June 2025 |
9.87 (-3.33%) |
10.23 |
9.82 - 10.24 |
0.6869 times |
Weekly price and charts AngiodynamicsInc Strong weekly Stock price targets for AngiodynamicsInc ANGO are 8.86 and 9.58 | Weekly Target 1 | 8.71 | | Weekly Target 2 | 9.01 | | Weekly Target 3 | 9.4266666666667 | | Weekly Target 4 | 9.73 | | Weekly Target 5 | 10.15 |
Weekly price and volumes for Angiodynamics Inc
| Date |
Closing |
Open |
Range |
Volume |
Fri 11 July 2025 |
9.32 (-2.71%) |
9.58 |
9.12 - 9.84 |
0.9336 times |
Thu 03 July 2025 |
9.58 (-2.04%) |
9.82 |
9.33 - 9.98 |
0.6609 times |
Fri 27 June 2025 |
9.78 (-2.4%) |
10.02 |
9.68 - 10.24 |
1.1446 times |
Fri 20 June 2025 |
10.02 (-6%) |
10.72 |
9.69 - 10.76 |
0.8682 times |
Fri 13 June 2025 |
10.66 (-3.62%) |
11.06 |
10.48 - 11.29 |
1.2785 times |
Fri 06 June 2025 |
11.06 (8.43%) |
10.16 |
9.36 - 12.11 |
1.9399 times |
Fri 30 May 2025 |
10.20 (7.94%) |
9.55 |
9.48 - 10.40 |
1.2282 times |
Fri 23 May 2025 |
9.45 (0.53%) |
9.25 |
9.14 - 9.79 |
0.6853 times |
Fri 16 May 2025 |
9.40 (3.18%) |
9.46 |
9.07 - 9.72 |
0.4846 times |
Fri 09 May 2025 |
9.11 (-1.94%) |
9.29 |
8.55 - 9.68 |
0.7761 times |
Fri 02 May 2025 |
9.29 (-3.23%) |
9.59 |
8.95 - 9.68 |
0.5171 times |
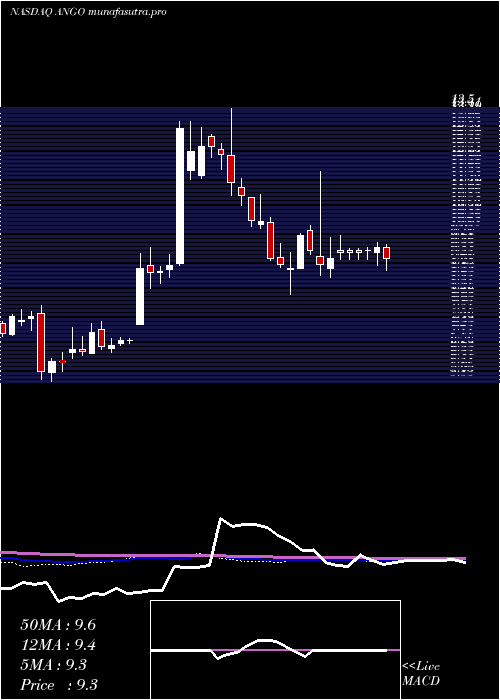
Monthly price and charts AngiodynamicsInc Strong monthly Stock price targets for AngiodynamicsInc ANGO are 8.81 and 9.64 | Monthly Target 1 | 8.63 | | Monthly Target 2 | 8.98 | | Monthly Target 3 | 9.4633333333333 | | Monthly Target 4 | 9.81 | | Monthly Target 5 | 10.29 |
Monthly price and volumes Angiodynamics Inc
| Date |
Closing |
Open |
Range |
Volume |
Fri 11 July 2025 |
9.32 (-6.05%) |
9.86 |
9.12 - 9.95 |
0.3164 times |
Mon 30 June 2025 |
9.92 (-2.75%) |
10.16 |
9.36 - 12.11 |
1.158 times |
Fri 30 May 2025 |
10.20 (9.8%) |
9.27 |
8.55 - 10.40 |
0.7332 times |
Wed 30 April 2025 |
9.29 (-1.06%) |
9.40 |
8.74 - 11.72 |
1.0001 times |
Mon 31 March 2025 |
9.39 (1.08%) |
9.30 |
8.27 - 10.21 |
0.7911 times |
Fri 28 February 2025 |
9.29 (-18.58%) |
11.27 |
9.23 - 11.54 |
0.7573 times |
Fri 31 January 2025 |
11.41 (24.56%) |
9.21 |
8.76 - 13.50 |
2.2469 times |
Tue 31 December 2024 |
9.16 (31.04%) |
7.44 |
7.44 - 9.58 |
0.9245 times |
Tue 26 November 2024 |
6.99 (4.48%) |
6.75 |
6.61 - 7.51 |
0.6365 times |
Thu 31 October 2024 |
6.69 (-14.01%) |
7.80 |
5.83 - 7.90 |
1.4361 times |
Mon 30 September 2024 |
7.78 (4.29%) |
7.46 |
7.10 - 7.97 |
0.5257 times |

DMA SMA EMA moving averages of Angiodynamics Inc ANGO
DMA (daily moving average) of Angiodynamics Inc ANGO
| DMA period | DMA value | | 5 day DMA | 9.36 | | 12 day DMA | 9.59 | | 20 day DMA | 9.9 | | 35 day DMA | 10.06 | | 50 day DMA | 9.81 | | 100 day DMA | 9.7 | | 150 day DMA | 9.94 | | 200 day DMA | 9.19 | EMA (exponential moving average) of Angiodynamics Inc ANGO
| EMA period | EMA current | EMA prev | EMA prev2 | | 5 day EMA | 9.42 | 9.47 | 9.47 | | 12 day EMA | 9.59 | 9.64 | 9.67 | | 20 day EMA | 9.75 | 9.8 | 9.83 | | 35 day EMA | 9.74 | 9.76 | 9.78 | | 50 day EMA | 9.74 | 9.76 | 9.77 |
SMA (simple moving average) of Angiodynamics Inc ANGO
| SMA period | SMA current | SMA prev | SMA prev2 | | 5 day SMA | 9.36 | 9.41 | 9.4 | | 12 day SMA | 9.59 | 9.66 | 9.7 | | 20 day SMA | 9.9 | 9.99 | 10.08 | | 35 day SMA | 10.06 | 10.07 | 10.06 | | 50 day SMA | 9.81 | 9.82 | 9.82 | | 100 day SMA | 9.7 | 9.71 | 9.72 | | 150 day SMA | 9.94 | 9.92 | 9.91 | | 200 day SMA | 9.19 | 9.18 | 9.17 |
|
|
