AmesiteInc AMST full analysis,charts,indicators,moving averages,SMA,DMA,EMA,ADX,MACD,RSIAmesite Inc AMST WideScreen charts, DMA,SMA,EMA technical analysis, forecast prediction, by indicators ADX,MACD,RSI,CCI NASDAQ stock exchange
Daily price and charts and targets AmesiteInc Strong Daily Stock price targets for AmesiteInc AMST are 2.26 and 2.42 | Daily Target 1 | 2.22 | | Daily Target 2 | 2.29 | | Daily Target 3 | 2.38 | | Daily Target 4 | 2.45 | | Daily Target 5 | 2.54 |
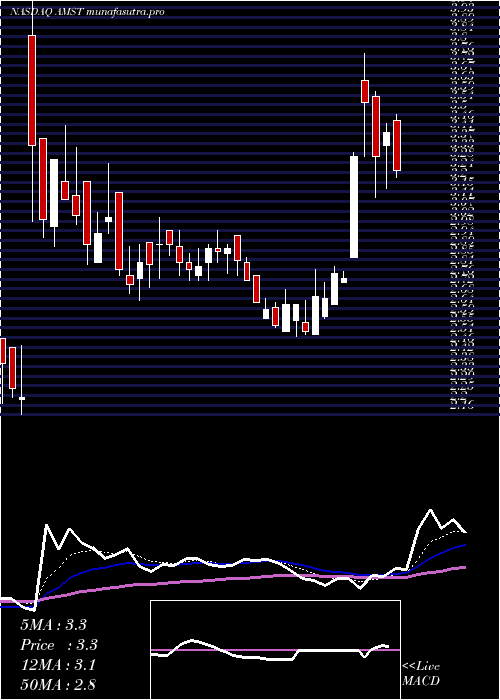
Daily price and volume Amesite Inc
| Date |
Closing |
Open |
Range |
Volume |
Fri 05 December 2025 |
2.36 (-4.45%) |
2.47 |
2.31 - 2.47 |
0.5171 times |
Thu 04 December 2025 |
2.47 (2.49%) |
2.40 |
2.35 - 2.49 |
0.3312 times |
Wed 03 December 2025 |
2.41 (1.26%) |
2.30 |
2.30 - 2.41 |
0.6217 times |
Tue 02 December 2025 |
2.38 (3.93%) |
2.28 |
2.28 - 2.38 |
0.6508 times |
Mon 01 December 2025 |
2.29 (-2.55%) |
2.35 |
2.25 - 2.44 |
1.5282 times |
Fri 28 November 2025 |
2.35 (2.17%) |
2.47 |
2.34 - 2.47 |
0.2789 times |
Wed 26 November 2025 |
2.30 (0%) |
2.27 |
2.27 - 2.51 |
1.075 times |
Tue 25 November 2025 |
2.30 (-0.43%) |
2.30 |
2.26 - 2.39 |
0.7031 times |
Mon 24 November 2025 |
2.31 (5.48%) |
2.16 |
2.16 - 2.42 |
2.1557 times |
Fri 21 November 2025 |
2.19 (-3.1%) |
2.19 |
2.10 - 2.24 |
2.1383 times |
Thu 20 November 2025 |
2.26 (-8.87%) |
2.47 |
2.26 - 2.47 |
1.2551 times |
Weekly price and charts AmesiteInc Strong weekly Stock price targets for AmesiteInc AMST are 2.31 and 2.55 | Weekly Target 1 | 2.13 | | Weekly Target 2 | 2.24 | | Weekly Target 3 | 2.3666666666667 | | Weekly Target 4 | 2.48 | | Weekly Target 5 | 2.61 |
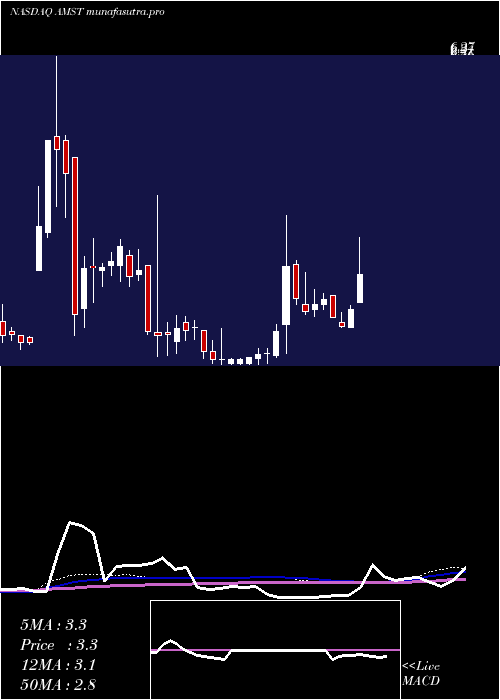
Weekly price and volumes for Amesite Inc
| Date |
Closing |
Open |
Range |
Volume |
Fri 05 December 2025 |
2.36 (0.43%) |
2.35 |
2.25 - 2.49 |
0.3197 times |
Fri 28 November 2025 |
2.35 (7.31%) |
2.16 |
2.16 - 2.51 |
0.3691 times |
Fri 21 November 2025 |
2.19 (-17.67%) |
2.60 |
2.10 - 2.64 |
0.5325 times |
Fri 14 November 2025 |
2.66 (-9.52%) |
2.94 |
2.65 - 3.05 |
0.3727 times |
Fri 07 November 2025 |
2.94 (-15.76%) |
3.28 |
2.79 - 3.32 |
0.5071 times |
Fri 31 October 2025 |
3.49 (0%) |
3.50 |
3.39 - 3.55 |
0.2372 times |
Fri 31 October 2025 |
3.49 (-0.57%) |
3.55 |
3.31 - 3.90 |
4.4148 times |
Fri 24 October 2025 |
3.51 (10.38%) |
3.23 |
3.16 - 3.55 |
0.6628 times |
Fri 17 October 2025 |
3.18 (-6.74%) |
3.52 |
3.06 - 3.60 |
1.0253 times |
Fri 10 October 2025 |
3.41 (7.23%) |
3.22 |
3.17 - 3.61 |
1.5588 times |
Fri 03 October 2025 |
3.18 (0.95%) |
3.19 |
2.95 - 3.29 |
1.6807 times |
Monthly price and charts AmesiteInc Strong monthly Stock price targets for AmesiteInc AMST are 2.31 and 2.55 | Monthly Target 1 | 2.13 | | Monthly Target 2 | 2.24 | | Monthly Target 3 | 2.3666666666667 | | Monthly Target 4 | 2.48 | | Monthly Target 5 | 2.61 |
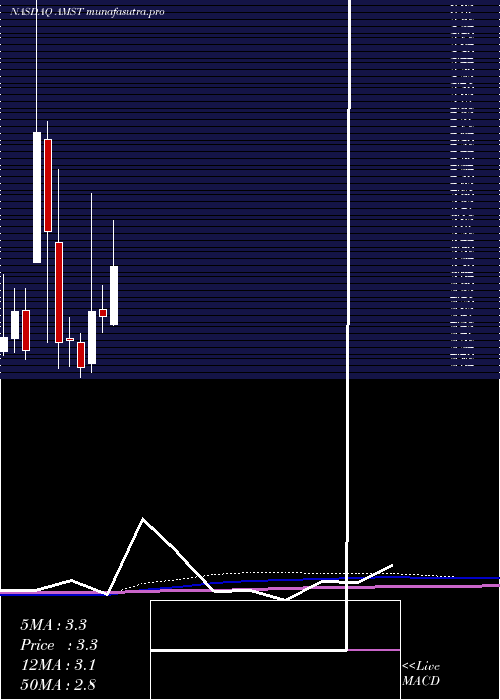
Monthly price and volumes Amesite Inc
| Date |
Closing |
Open |
Range |
Volume |
Fri 05 December 2025 |
2.36 (0.43%) |
2.35 |
2.25 - 2.49 |
0.0053 times |
Fri 28 November 2025 |
2.35 (-32.66%) |
3.28 |
2.10 - 3.32 |
0.0295 times |
Fri 31 October 2025 |
3.49 (14.43%) |
2.98 |
2.95 - 3.90 |
0.1384 times |
Tue 30 September 2025 |
3.05 (10.51%) |
2.72 |
2.60 - 4.78 |
3.6662 times |
Fri 29 August 2025 |
2.76 (-8%) |
3.03 |
2.53 - 3.03 |
0.0299 times |
Thu 31 July 2025 |
3.00 (11.52%) |
2.60 |
2.59 - 3.77 |
0.1977 times |
Mon 30 June 2025 |
2.69 (-1.82%) |
2.77 |
2.51 - 3.04 |
0.0676 times |
Fri 30 May 2025 |
2.74 (29.25%) |
2.16 |
2.06 - 4.07 |
5.6782 times |
Wed 30 April 2025 |
2.12 (-12.4%) |
2.40 |
2.00 - 2.50 |
0.0865 times |
Mon 31 March 2025 |
2.42 (0.83%) |
2.44 |
2.13 - 2.68 |
0.1007 times |
Fri 28 February 2025 |
2.40 (-34.07%) |
3.52 |
2.11 - 4.34 |
3.817 times |
DMA SMA EMA moving averages of Amesite Inc AMST
DMA (daily moving average) of Amesite Inc AMST
| DMA period | DMA value | | 5 day DMA | 2.38 | | 12 day DMA | 2.34 | | 20 day DMA | 2.53 | | 35 day DMA | 2.89 | | 50 day DMA | 3.02 | | 100 day DMA | 2.99 | | 150 day DMA | 2.93 | | 200 day DMA | 2.77 | EMA (exponential moving average) of Amesite Inc AMST
| EMA period | EMA current | EMA prev | EMA prev2 | | 5 day EMA | 2.39 | 2.4 | 2.36 | | 12 day EMA | 2.43 | 2.44 | 2.44 | | 20 day EMA | 2.55 | 2.57 | 2.58 | | 35 day EMA | 2.73 | 2.75 | 2.77 | | 50 day EMA | 2.97 | 2.99 | 3.01 |
SMA (simple moving average) of Amesite Inc AMST
| SMA period | SMA current | SMA prev | SMA prev2 | | 5 day SMA | 2.38 | 2.38 | 2.35 | | 12 day SMA | 2.34 | 2.36 | 2.37 | | 20 day SMA | 2.53 | 2.55 | 2.59 | | 35 day SMA | 2.89 | 2.92 | 2.94 | | 50 day SMA | 3.02 | 3.03 | 3.05 | | 100 day SMA | 2.99 | 3 | 3.01 | | 150 day SMA | 2.93 | 2.93 | 2.93 | | 200 day SMA | 2.77 | 2.77 | 2.78 |
|
|
