AkamaiTechnologies AKAM full analysis,charts,indicators,moving averages,SMA,DMA,EMA,ADX,MACD,RSIAkamai Technologies AKAM WideScreen charts, DMA,SMA,EMA technical analysis, forecast prediction, by indicators ADX,MACD,RSI,CCI NASDAQ stock exchange
operates under Miscellaneous sector & deals in Business Services
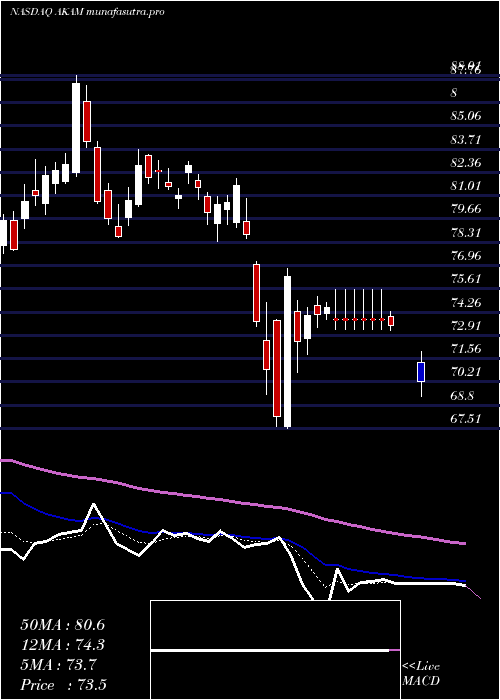
Daily price and charts and targets AkamaiTechnologies Strong Daily Stock price targets for AkamaiTechnologies AKAM are 76.15 and 77.37 | Daily Target 1 | 75.93 | | Daily Target 2 | 76.37 | | Daily Target 3 | 77.153333333333 | | Daily Target 4 | 77.59 | | Daily Target 5 | 78.37 |
Daily price and volume Akamai Technologies
| Date |
Closing |
Open |
Range |
Volume |
Tue 15 July 2025 |
76.80 (-0.79%) |
77.74 |
76.72 - 77.94 |
0.7747 times |
Mon 14 July 2025 |
77.41 (0.04%) |
77.35 |
76.88 - 78.06 |
0.9919 times |
Fri 11 July 2025 |
77.38 (-2.59%) |
78.80 |
77.36 - 79.18 |
0.9955 times |
Thu 10 July 2025 |
79.44 (-1.48%) |
80.59 |
79.23 - 80.61 |
0.9085 times |
Wed 09 July 2025 |
80.63 (-0.01%) |
80.89 |
79.72 - 81.04 |
0.7632 times |
Tue 08 July 2025 |
80.64 (2%) |
79.61 |
79.19 - 81.45 |
1.2806 times |
Mon 07 July 2025 |
79.06 (-0.53%) |
78.93 |
78.59 - 79.83 |
1.3089 times |
Thu 03 July 2025 |
79.48 (0.03%) |
80.33 |
79.08 - 80.54 |
0.9201 times |
Wed 02 July 2025 |
79.46 (-0.19%) |
79.56 |
78.81 - 79.89 |
0.9901 times |
Tue 01 July 2025 |
79.61 (-0.19%) |
79.70 |
79.23 - 80.92 |
1.0665 times |
Mon 30 June 2025 |
79.76 (0.2%) |
80.00 |
79.19 - 80.28 |
1.5452 times |
Weekly price and charts AkamaiTechnologies Strong weekly Stock price targets for AkamaiTechnologies AKAM are 76.09 and 77.43 | Weekly Target 1 | 75.85 | | Weekly Target 2 | 76.33 | | Weekly Target 3 | 77.193333333333 | | Weekly Target 4 | 77.67 | | Weekly Target 5 | 78.53 |
Weekly price and volumes for Akamai Technologies
| Date |
Closing |
Open |
Range |
Volume |
Tue 15 July 2025 |
76.80 (-0.75%) |
77.35 |
76.72 - 78.06 |
0.2049 times |
Fri 11 July 2025 |
77.38 (-2.64%) |
78.93 |
77.36 - 81.45 |
0.6098 times |
Thu 03 July 2025 |
79.48 (-0.15%) |
80.00 |
78.81 - 80.92 |
0.5245 times |
Fri 27 June 2025 |
79.60 (1.56%) |
78.05 |
77.20 - 80.38 |
1.2222 times |
Fri 20 June 2025 |
78.38 (1.75%) |
79.52 |
77.62 - 79.72 |
1.034 times |
Fri 13 June 2025 |
77.03 (0%) |
77.51 |
76.86 - 79.66 |
1.0157 times |
Fri 06 June 2025 |
77.03 (1.45%) |
75.56 |
74.69 - 77.86 |
0.8539 times |
Fri 30 May 2025 |
75.93 (0.12%) |
77.00 |
74.75 - 78.04 |
0.7315 times |
Fri 23 May 2025 |
75.84 (-2.81%) |
76.80 |
75.75 - 78.90 |
1.128 times |
Fri 16 May 2025 |
78.03 (2.33%) |
79.01 |
74.85 - 79.70 |
2.6756 times |
Fri 09 May 2025 |
76.25 (-7.62%) |
82.17 |
76.20 - 86.15 |
1.3581 times |
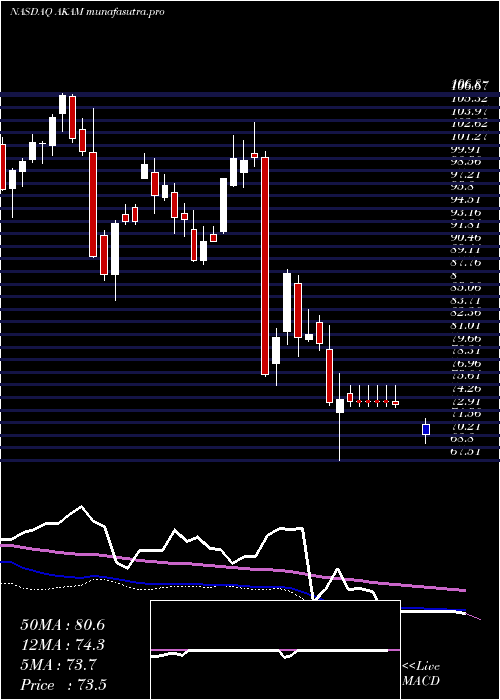
Monthly price and charts AkamaiTechnologies Strong monthly Stock price targets for AkamaiTechnologies AKAM are 74.4 and 79.13 | Monthly Target 1 | 73.59 | | Monthly Target 2 | 75.2 | | Monthly Target 3 | 78.323333333333 | | Monthly Target 4 | 79.93 | | Monthly Target 5 | 83.05 |
Monthly price and volumes Akamai Technologies
| Date |
Closing |
Open |
Range |
Volume |
Tue 15 July 2025 |
76.80 (-3.71%) |
79.70 |
76.72 - 81.45 |
0.2994 times |
Mon 30 June 2025 |
79.76 (5.04%) |
75.56 |
74.69 - 80.38 |
1.1111 times |
Fri 30 May 2025 |
75.93 (-5.77%) |
81.30 |
74.75 - 86.15 |
1.5804 times |
Wed 30 April 2025 |
80.58 (0.1%) |
80.22 |
67.51 - 81.99 |
0.8622 times |
Mon 31 March 2025 |
80.50 (-0.22%) |
81.29 |
78.36 - 88.01 |
1.2218 times |
Fri 28 February 2025 |
80.68 (-19.24%) |
98.40 |
75.50 - 103.75 |
1.6411 times |
Fri 31 January 2025 |
99.90 (4.44%) |
96.67 |
88.50 - 102.37 |
0.911 times |
Tue 31 December 2024 |
95.65 (2.74%) |
97.75 |
93.93 - 100.39 |
0.4969 times |
Tue 26 November 2024 |
93.10 (-7.89%) |
101.16 |
84.70 - 105.26 |
1.1973 times |
Thu 31 October 2024 |
101.08 (0.13%) |
100.58 |
99.36 - 106.80 |
0.6788 times |
Mon 30 September 2024 |
100.95 (-0.87%) |
101.32 |
93.50 - 102.49 |
0.6467 times |

DMA SMA EMA moving averages of Akamai Technologies AKAM
DMA (daily moving average) of Akamai Technologies AKAM
| DMA period | DMA value | | 5 day DMA | 78.33 | | 12 day DMA | 79.11 | | 20 day DMA | 79.03 | | 35 day DMA | 78.17 | | 50 day DMA | 78.63 | | 100 day DMA | 78.45 | | 150 day DMA | 84.54 | | 200 day DMA | 88.11 | EMA (exponential moving average) of Akamai Technologies AKAM
| EMA period | EMA current | EMA prev | EMA prev2 | | 5 day EMA | 77.93 | 78.49 | 79.03 | | 12 day EMA | 78.63 | 78.96 | 79.24 | | 20 day EMA | 78.73 | 78.93 | 79.09 | | 35 day EMA | 78.86 | 78.98 | 79.07 | | 50 day EMA | 78.7 | 78.78 | 78.84 |
SMA (simple moving average) of Akamai Technologies AKAM
| SMA period | SMA current | SMA prev | SMA prev2 | | 5 day SMA | 78.33 | 79.1 | 79.43 | | 12 day SMA | 79.11 | 79.34 | 79.52 | | 20 day SMA | 79.03 | 79.11 | 79.15 | | 35 day SMA | 78.17 | 78.16 | 78.16 | | 50 day SMA | 78.63 | 78.71 | 78.78 | | 100 day SMA | 78.45 | 78.66 | 78.89 | | 150 day SMA | 84.54 | 84.69 | 84.79 | | 200 day SMA | 88.11 | 88.22 | 88.32 |
|
|
