AgncInvestment AGNCN full analysis,charts,indicators,moving averages,SMA,DMA,EMA,ADX,MACD,RSIAgnc Investment AGNCN WideScreen charts, DMA,SMA,EMA technical analysis, forecast prediction, by indicators ADX,MACD,RSI,CCI NASDAQ stock exchange
operates under Consumer Services sector & deals in Real Estate Investment Trusts
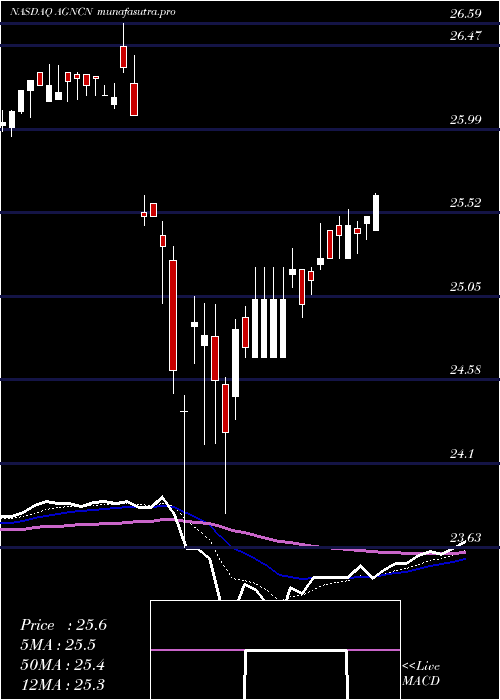
Daily price and charts and targets AgncInvestment Strong Daily Stock price targets for AgncInvestment AGNCN are 25.26 and 25.34 | Daily Target 1 | 25.24 | | Daily Target 2 | 25.27 | | Daily Target 3 | 25.32 | | Daily Target 4 | 25.35 | | Daily Target 5 | 25.4 |
Daily price and volume Agnc Investment
| Date |
Closing |
Open |
Range |
Volume |
Mon 14 July 2025 |
25.30 (-0.16%) |
25.31 |
25.29 - 25.37 |
0.3749 times |
Fri 11 July 2025 |
25.34 (-0.04%) |
25.32 |
25.30 - 25.37 |
0.2649 times |
Thu 10 July 2025 |
25.35 (0.16%) |
25.30 |
25.30 - 25.35 |
0.3412 times |
Wed 09 July 2025 |
25.31 (-0.04%) |
25.28 |
25.24 - 25.33 |
0.3345 times |
Tue 08 July 2025 |
25.32 (0.32%) |
25.22 |
25.18 - 25.32 |
0.3659 times |
Mon 07 July 2025 |
25.24 (-0.24%) |
25.28 |
25.14 - 25.30 |
0.853 times |
Thu 03 July 2025 |
25.30 (0.16%) |
25.25 |
25.25 - 25.30 |
0.2626 times |
Wed 02 July 2025 |
25.26 (0.4%) |
25.23 |
25.15 - 25.28 |
0.532 times |
Tue 01 July 2025 |
25.16 (-1.22%) |
25.00 |
25.00 - 25.19 |
0.8822 times |
Mon 30 June 2025 |
25.47 (-1.36%) |
25.89 |
25.46 - 25.94 |
5.789 times |
Fri 27 June 2025 |
25.82 (-0.04%) |
25.72 |
25.72 - 25.94 |
0.5095 times |
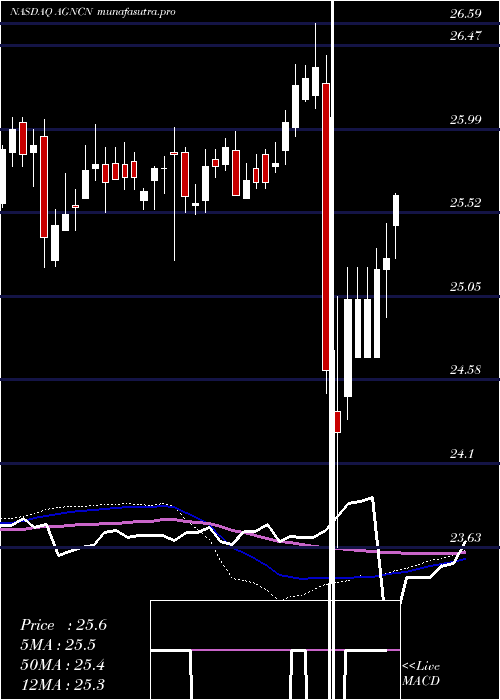
Weekly price and charts AgncInvestment Strong weekly Stock price targets for AgncInvestment AGNCN are 25.26 and 25.34 | Weekly Target 1 | 25.24 | | Weekly Target 2 | 25.27 | | Weekly Target 3 | 25.32 | | Weekly Target 4 | 25.35 | | Weekly Target 5 | 25.4 |
Weekly price and volumes for Agnc Investment
| Date |
Closing |
Open |
Range |
Volume |
Mon 14 July 2025 |
25.30 (-0.16%) |
25.31 |
25.29 - 25.37 |
0.1619 times |
Fri 11 July 2025 |
25.34 (0.16%) |
25.28 |
25.14 - 25.37 |
0.9327 times |
Thu 03 July 2025 |
25.30 (-2.01%) |
25.89 |
25.00 - 25.94 |
3.2247 times |
Fri 27 June 2025 |
25.82 (0.58%) |
25.74 |
25.63 - 25.94 |
0.9608 times |
Fri 20 June 2025 |
25.67 (0.08%) |
25.81 |
25.63 - 25.81 |
0.7892 times |
Fri 13 June 2025 |
25.65 (0.35%) |
25.56 |
25.55 - 25.88 |
0.8687 times |
Fri 06 June 2025 |
25.56 (0.59%) |
25.46 |
25.32 - 25.68 |
0.7979 times |
Fri 30 May 2025 |
25.41 (-0.63%) |
25.61 |
25.38 - 25.75 |
1.0297 times |
Fri 23 May 2025 |
25.57 (-0.39%) |
25.62 |
25.50 - 25.76 |
0.604 times |
Fri 16 May 2025 |
25.67 (0.08%) |
25.69 |
25.56 - 25.77 |
0.6302 times |
Fri 09 May 2025 |
25.65 (0.12%) |
25.62 |
25.49 - 25.75 |
0.4557 times |
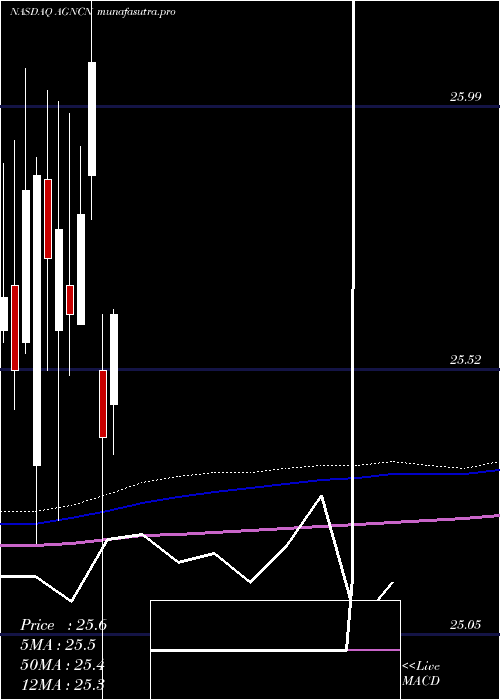
Monthly price and charts AgncInvestment Strong monthly Stock price targets for AgncInvestment AGNCN are 25.15 and 25.52 | Monthly Target 1 | 24.85 | | Monthly Target 2 | 25.08 | | Monthly Target 3 | 25.223333333333 | | Monthly Target 4 | 25.45 | | Monthly Target 5 | 25.59 |
Monthly price and volumes Agnc Investment
| Date |
Closing |
Open |
Range |
Volume |
Mon 14 July 2025 |
25.30 (-0.67%) |
25.00 |
25.00 - 25.37 |
0.3578 times |
Mon 30 June 2025 |
25.47 (0.24%) |
25.46 |
25.32 - 25.94 |
1.1639 times |
Fri 30 May 2025 |
25.41 (0.04%) |
25.46 |
25.37 - 25.77 |
0.5868 times |
Wed 30 April 2025 |
25.40 (-2.57%) |
25.52 |
23.63 - 25.62 |
2.2036 times |
Mon 31 March 2025 |
26.07 (1.05%) |
25.87 |
25.79 - 26.59 |
1.0191 times |
Fri 28 February 2025 |
25.80 (0.7%) |
25.60 |
25.60 - 25.92 |
0.5435 times |
Fri 31 January 2025 |
25.62 (-0.58%) |
25.67 |
25.51 - 25.98 |
1.622 times |
Tue 31 December 2024 |
25.77 (0.19%) |
25.59 |
25.25 - 26.00 |
0.8002 times |
Tue 26 November 2024 |
25.72 (-0.58%) |
25.86 |
25.52 - 26.02 |
0.6209 times |
Thu 31 October 2024 |
25.87 (0.12%) |
25.35 |
25.21 - 25.90 |
1.0821 times |
Mon 30 September 2024 |
25.84 (1.25%) |
25.57 |
25.55 - 26.06 |
1.1927 times |
DMA SMA EMA moving averages of Agnc Investment AGNCN
DMA (daily moving average) of Agnc Investment AGNCN
| DMA period | DMA value | | 5 day DMA | 25.32 | | 12 day DMA | 25.39 | | 20 day DMA | 25.53 | | 35 day DMA | 25.55 | | 50 day DMA | 25.58 | | 100 day DMA | 25.59 | | 150 day DMA | 25.63 | | 200 day DMA | 25.64 | EMA (exponential moving average) of Agnc Investment AGNCN
| EMA period | EMA current | EMA prev | EMA prev2 | | 5 day EMA | 25.32 | 25.33 | 25.33 | | 12 day EMA | 25.4 | 25.42 | 25.43 | | 20 day EMA | 25.45 | 25.47 | 25.48 | | 35 day EMA | 25.49 | 25.5 | 25.51 | | 50 day EMA | 25.52 | 25.53 | 25.54 |
SMA (simple moving average) of Agnc Investment AGNCN
| SMA period | SMA current | SMA prev | SMA prev2 | | 5 day SMA | 25.32 | 25.31 | 25.3 | | 12 day SMA | 25.39 | 25.44 | 25.47 | | 20 day SMA | 25.53 | 25.55 | 25.56 | | 35 day SMA | 25.55 | 25.57 | 25.58 | | 50 day SMA | 25.58 | 25.58 | 25.58 | | 100 day SMA | 25.59 | 25.59 | 25.59 | | 150 day SMA | 25.63 | 25.64 | 25.64 | | 200 day SMA | 25.64 | 25.65 | 25.65 |
|
|
