AdverumBiotechnologies ADVM full analysis,charts,indicators,moving averages,SMA,DMA,EMA,ADX,MACD,RSIAdverum Biotechnologies ADVM WideScreen charts, DMA,SMA,EMA technical analysis, forecast prediction, by indicators ADX,MACD,RSI,CCI NASDAQ stock exchange
operates under Health Care sector & deals in Biotechnology Biological Products No Diagnostic Substances
Daily price and charts and targets AdverumBiotechnologies Strong Daily Stock price targets for AdverumBiotechnologies ADVM are 4.21 and 4.34 | Daily Target 1 | 4.1 | | Daily Target 2 | 4.18 | | Daily Target 3 | 4.23 | | Daily Target 4 | 4.31 | | Daily Target 5 | 4.36 |
Daily price and volume Adverum Biotechnologies
| Date |
Closing |
Open |
Range |
Volume |
Fri 05 December 2025 |
4.26 (2.16%) |
4.15 |
4.15 - 4.28 |
1.2539 times |
Thu 04 December 2025 |
4.17 (0%) |
4.17 |
4.16 - 4.24 |
2.5674 times |
Wed 03 December 2025 |
4.17 (0.24%) |
4.17 |
4.16 - 4.19 |
0.8667 times |
Tue 02 December 2025 |
4.16 (-0.95%) |
4.20 |
4.15 - 4.22 |
0.8413 times |
Mon 01 December 2025 |
4.20 (1.94%) |
4.11 |
4.07 - 4.23 |
1.6151 times |
Fri 28 November 2025 |
4.12 (-0.96%) |
4.17 |
4.12 - 4.18 |
0.1932 times |
Wed 26 November 2025 |
4.16 (1.71%) |
4.09 |
4.09 - 4.17 |
0.4372 times |
Tue 25 November 2025 |
4.09 (-0.73%) |
4.12 |
3.99 - 4.16 |
1.0461 times |
Mon 24 November 2025 |
4.12 (-0.48%) |
4.15 |
4.07 - 4.21 |
0.7967 times |
Fri 21 November 2025 |
4.14 (-1.19%) |
4.18 |
4.14 - 4.19 |
0.3825 times |
Thu 20 November 2025 |
4.19 (-1.41%) |
4.25 |
4.17 - 4.27 |
0.627 times |
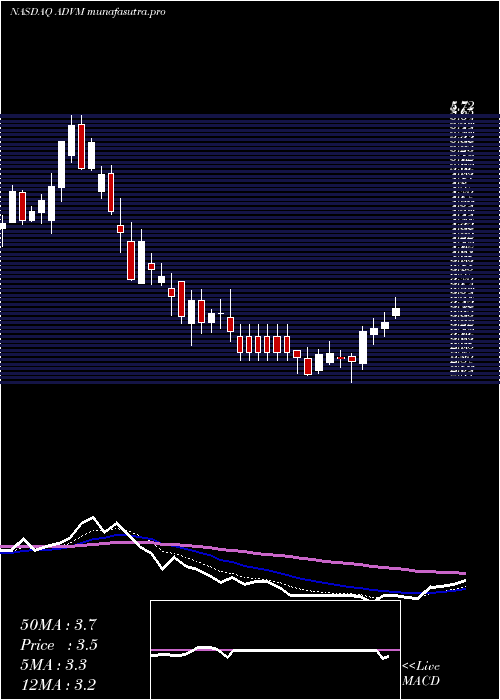
Weekly price and charts AdverumBiotechnologies Strong weekly Stock price targets for AdverumBiotechnologies ADVM are 4.17 and 4.38 | Weekly Target 1 | 3.99 | | Weekly Target 2 | 4.13 | | Weekly Target 3 | 4.2033333333333 | | Weekly Target 4 | 4.34 | | Weekly Target 5 | 4.41 |
Weekly price and volumes for Adverum Biotechnologies
| Date |
Closing |
Open |
Range |
Volume |
Fri 05 December 2025 |
4.26 (3.4%) |
4.11 |
4.07 - 4.28 |
1.2643 times |
Fri 28 November 2025 |
4.12 (-0.48%) |
4.15 |
3.99 - 4.21 |
0.4377 times |
Fri 21 November 2025 |
4.14 (-3.5%) |
4.27 |
4.14 - 4.28 |
0.8499 times |
Fri 14 November 2025 |
4.29 (-0.69%) |
4.34 |
4.24 - 4.36 |
0.376 times |
Fri 07 November 2025 |
4.32 (0.47%) |
4.26 |
4.26 - 4.37 |
0.3598 times |
Fri 31 October 2025 |
4.30 (0%) |
4.20 |
4.18 - 4.31 |
0.2603 times |
Fri 31 October 2025 |
4.30 (5.91%) |
4.05 |
3.98 - 4.34 |
1.1083 times |
Fri 24 October 2025 |
4.06 (-7.09%) |
4.29 |
3.98 - 4.61 |
4.5548 times |
Fri 17 October 2025 |
4.37 (-9.15%) |
4.86 |
4.10 - 4.95 |
0.3398 times |
Fri 10 October 2025 |
4.81 (-12.39%) |
5.65 |
4.72 - 5.75 |
0.4491 times |
Fri 03 October 2025 |
5.49 (21.73%) |
4.69 |
4.34 - 5.75 |
0.6594 times |
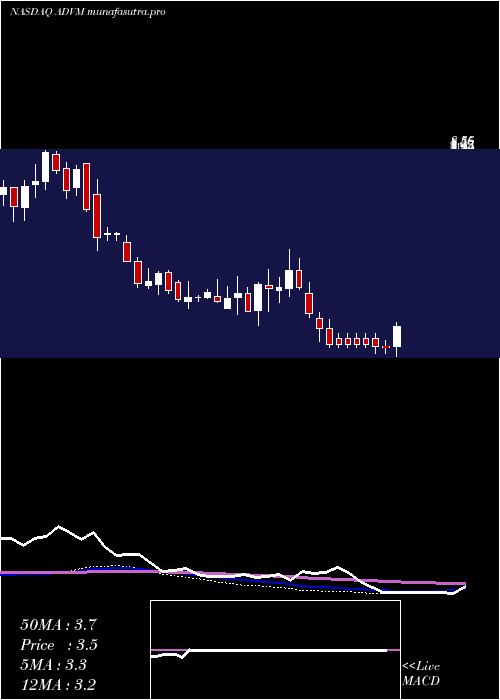
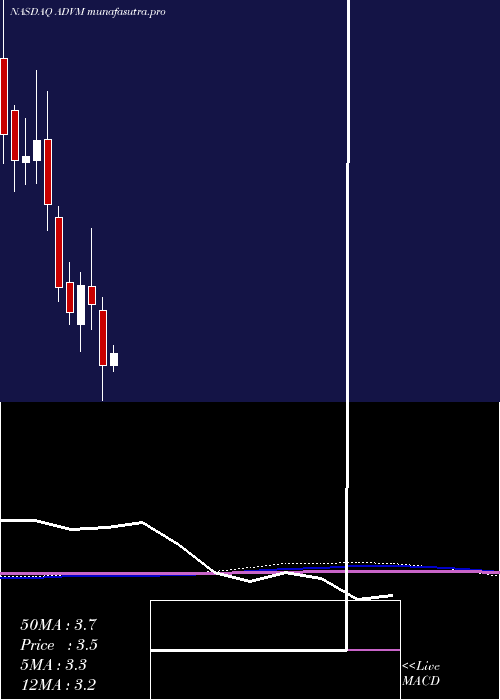
Monthly price and charts AdverumBiotechnologies Strong monthly Stock price targets for AdverumBiotechnologies ADVM are 4.17 and 4.38 | Monthly Target 1 | 3.99 | | Monthly Target 2 | 4.13 | | Monthly Target 3 | 4.2033333333333 | | Monthly Target 4 | 4.34 | | Monthly Target 5 | 4.41 |
Monthly price and volumes Adverum Biotechnologies
| Date |
Closing |
Open |
Range |
Volume |
Fri 05 December 2025 |
4.26 (3.4%) |
4.11 |
4.07 - 4.28 |
0.5017 times |
Fri 28 November 2025 |
4.12 (-4.19%) |
4.26 |
3.99 - 4.37 |
0.803 times |
Fri 31 October 2025 |
4.30 (-5.08%) |
4.56 |
3.98 - 5.75 |
2.8434 times |
Tue 30 September 2025 |
4.53 (47.08%) |
3.03 |
2.87 - 5.19 |
1.7521 times |
Fri 29 August 2025 |
3.08 (28.87%) |
2.35 |
2.20 - 3.25 |
0.2527 times |
Thu 31 July 2025 |
2.39 (11.16%) |
2.14 |
2.11 - 2.91 |
0.3524 times |
Mon 30 June 2025 |
2.15 (-3.15%) |
2.25 |
2.13 - 3.10 |
0.8948 times |
Fri 30 May 2025 |
2.22 (-31.9%) |
3.26 |
1.78 - 3.64 |
1.2019 times |
Wed 30 April 2025 |
3.26 (-25.4%) |
4.26 |
2.64 - 4.48 |
1.0333 times |
Mon 31 March 2025 |
4.37 (-7.22%) |
4.69 |
3.92 - 5.72 |
0.3645 times |
Fri 28 February 2025 |
4.71 (11.61%) |
4.01 |
3.52 - 4.93 |
0.5081 times |
DMA SMA EMA moving averages of Adverum Biotechnologies ADVM
DMA (daily moving average) of Adverum Biotechnologies ADVM
| DMA period | DMA value | | 5 day DMA | 4.19 | | 12 day DMA | 4.17 | | 20 day DMA | 4.22 | | 35 day DMA | 4.25 | | 50 day DMA | 4.42 | | 100 day DMA | 3.69 | | 150 day DMA | 3.3 | | 200 day DMA | 3.46 | EMA (exponential moving average) of Adverum Biotechnologies ADVM
| EMA period | EMA current | EMA prev | EMA prev2 | | 5 day EMA | 4.19 | 4.16 | 4.16 | | 12 day EMA | 4.2 | 4.19 | 4.19 | | 20 day EMA | 4.21 | 4.21 | 4.21 | | 35 day EMA | 4.28 | 4.28 | 4.29 | | 50 day EMA | 4.36 | 4.36 | 4.37 |
SMA (simple moving average) of Adverum Biotechnologies ADVM
| SMA period | SMA current | SMA prev | SMA prev2 | | 5 day SMA | 4.19 | 4.16 | 4.16 | | 12 day SMA | 4.17 | 4.17 | 4.18 | | 20 day SMA | 4.22 | 4.22 | 4.22 | | 35 day SMA | 4.25 | 4.26 | 4.26 | | 50 day SMA | 4.42 | 4.43 | 4.43 | | 100 day SMA | 3.69 | 3.68 | 3.66 | | 150 day SMA | 3.3 | 3.3 | 3.29 | | 200 day SMA | 3.46 | 3.46 | 3.46 |
|
|
