AdvantageSolutions ADV full analysis,charts,indicators,moving averages,SMA,DMA,EMA,ADX,MACD,RSIAdvantage Solutions ADV WideScreen charts, DMA,SMA,EMA technical analysis, forecast prediction, by indicators ADX,MACD,RSI,CCI NASDAQ stock exchange
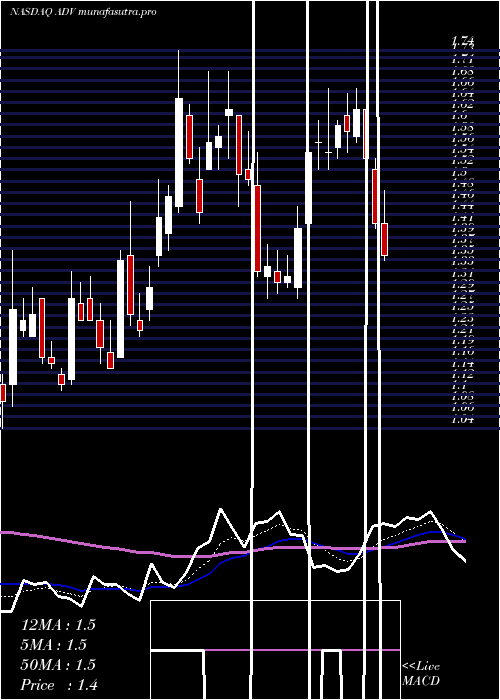
Daily price and charts and targets AdvantageSolutions Strong Daily Stock price targets for AdvantageSolutions ADV are 0.8 and 0.91 | Daily Target 1 | 0.78 | | Daily Target 2 | 0.82 | | Daily Target 3 | 0.89 | | Daily Target 4 | 0.93 | | Daily Target 5 | 1 |
Daily price and volume Advantage Solutions
| Date |
Closing |
Open |
Range |
Volume |
Fri 05 December 2025 |
0.86 (-10.42%) |
0.96 |
0.85 - 0.96 |
1.8678 times |
Thu 04 December 2025 |
0.96 (0%) |
0.97 |
0.96 - 1.02 |
0.7672 times |
Wed 03 December 2025 |
0.96 (5.49%) |
0.94 |
0.93 - 0.96 |
0.8998 times |
Tue 02 December 2025 |
0.91 (-2.15%) |
0.97 |
0.90 - 0.97 |
1.3074 times |
Mon 01 December 2025 |
0.93 (-2.11%) |
0.94 |
0.92 - 0.99 |
0.9573 times |
Fri 28 November 2025 |
0.95 (1.06%) |
0.94 |
0.94 - 0.97 |
0.3532 times |
Wed 26 November 2025 |
0.94 (2.17%) |
0.91 |
0.90 - 0.94 |
1.0317 times |
Tue 25 November 2025 |
0.92 (1.1%) |
0.90 |
0.90 - 0.95 |
0.6118 times |
Mon 24 November 2025 |
0.91 (-9%) |
1.02 |
0.90 - 1.02 |
1.2939 times |
Fri 21 November 2025 |
1.00 (4.17%) |
0.96 |
0.96 - 1.03 |
0.91 times |
Thu 20 November 2025 |
0.96 (-6.8%) |
1.07 |
0.95 - 1.08 |
1.1644 times |
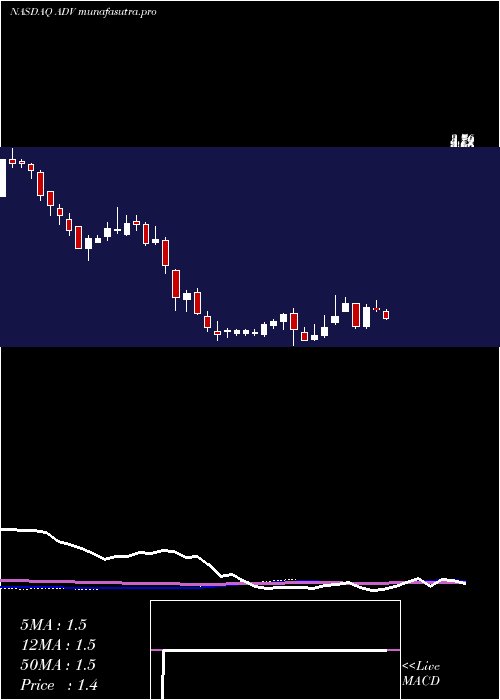
Weekly price and charts AdvantageSolutions Strong weekly Stock price targets for AdvantageSolutions ADV are 0.77 and 0.94 | Weekly Target 1 | 0.74 | | Weekly Target 2 | 0.8 | | Weekly Target 3 | 0.91 | | Weekly Target 4 | 0.97 | | Weekly Target 5 | 1.08 |
Weekly price and volumes for Advantage Solutions
| Date |
Closing |
Open |
Range |
Volume |
Fri 05 December 2025 |
0.86 (-9.47%) |
0.94 |
0.85 - 1.02 |
1.4601 times |
Fri 28 November 2025 |
0.95 (-5%) |
1.02 |
0.90 - 1.02 |
0.8285 times |
Fri 21 November 2025 |
1.00 (-13.04%) |
1.13 |
0.95 - 1.16 |
1.0514 times |
Fri 14 November 2025 |
1.15 (1.77%) |
1.16 |
1.14 - 1.39 |
1.4031 times |
Fri 07 November 2025 |
1.13 (-11.72%) |
1.26 |
1.12 - 1.31 |
1.4818 times |
Fri 31 October 2025 |
1.28 (0%) |
1.30 |
1.26 - 1.31 |
0.3079 times |
Fri 31 October 2025 |
1.28 (-14.67%) |
1.50 |
1.26 - 1.53 |
0.8973 times |
Fri 24 October 2025 |
1.50 (9.49%) |
1.38 |
1.35 - 1.53 |
0.7733 times |
Fri 17 October 2025 |
1.37 (-7.43%) |
1.46 |
1.35 - 1.58 |
0.8777 times |
Fri 10 October 2025 |
1.48 (-0.67%) |
1.49 |
1.46 - 1.55 |
0.9189 times |
Fri 03 October 2025 |
1.49 (-4.49%) |
1.55 |
1.44 - 1.56 |
1.097 times |
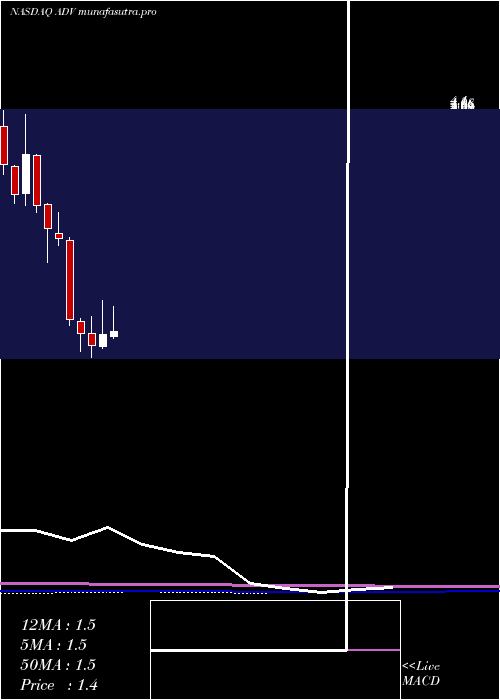
Monthly price and charts AdvantageSolutions Strong monthly Stock price targets for AdvantageSolutions ADV are 0.77 and 0.94 | Monthly Target 1 | 0.74 | | Monthly Target 2 | 0.8 | | Monthly Target 3 | 0.91 | | Monthly Target 4 | 0.97 | | Monthly Target 5 | 1.08 |
Monthly price and volumes Advantage Solutions
| Date |
Closing |
Open |
Range |
Volume |
Fri 05 December 2025 |
0.86 (-9.47%) |
0.94 |
0.85 - 1.02 |
0.2478 times |
Fri 28 November 2025 |
0.95 (-25.78%) |
1.26 |
0.90 - 1.39 |
0.8088 times |
Fri 31 October 2025 |
1.28 (-16.34%) |
1.51 |
1.26 - 1.58 |
0.735 times |
Tue 30 September 2025 |
1.53 (-15.93%) |
1.77 |
1.51 - 2.05 |
1.214 times |
Fri 29 August 2025 |
1.82 (32.85%) |
1.32 |
1.28 - 2.14 |
1.4975 times |
Thu 31 July 2025 |
1.37 (3.79%) |
1.30 |
1.28 - 1.82 |
1.3206 times |
Mon 30 June 2025 |
1.32 (10.92%) |
1.18 |
1.15 - 1.74 |
1.1134 times |
Fri 30 May 2025 |
1.19 (-11.19%) |
1.34 |
1.04 - 1.55 |
0.9936 times |
Wed 30 April 2025 |
1.34 (-11.26%) |
1.48 |
1.11 - 1.52 |
0.7361 times |
Mon 31 March 2025 |
1.51 (-39.84%) |
2.49 |
1.43 - 2.53 |
1.3333 times |
Fri 28 February 2025 |
2.51 (-4.92%) |
2.57 |
2.42 - 2.84 |
0.4525 times |
DMA SMA EMA moving averages of Advantage Solutions ADV
DMA (daily moving average) of Advantage Solutions ADV
| DMA period | DMA value | | 5 day DMA | 0.92 | | 12 day DMA | 0.94 | | 20 day DMA | 1.04 | | 35 day DMA | 1.18 | | 50 day DMA | 1.27 | | 100 day DMA | 1.49 | | 150 day DMA | 1.45 | | 200 day DMA | 1.5 | EMA (exponential moving average) of Advantage Solutions ADV
| EMA period | EMA current | EMA prev | EMA prev2 | | 5 day EMA | 0.92 | 0.95 | 0.95 | | 12 day EMA | 0.97 | 0.99 | 0.99 | | 20 day EMA | 1.02 | 1.04 | 1.05 | | 35 day EMA | 1.14 | 1.16 | 1.17 | | 50 day EMA | 1.27 | 1.29 | 1.3 |
SMA (simple moving average) of Advantage Solutions ADV
| SMA period | SMA current | SMA prev | SMA prev2 | | 5 day SMA | 0.92 | 0.94 | 0.94 | | 12 day SMA | 0.94 | 0.96 | 0.97 | | 20 day SMA | 1.04 | 1.06 | 1.07 | | 35 day SMA | 1.18 | 1.19 | 1.21 | | 50 day SMA | 1.27 | 1.29 | 1.3 | | 100 day SMA | 1.49 | 1.5 | 1.5 | | 150 day SMA | 1.45 | 1.45 | 1.46 | | 200 day SMA | 1.5 | 1.51 | 1.52 |
|
|
