ArchCapital ACGLO full analysis,charts,indicators,moving averages,SMA,DMA,EMA,ADX,MACD,RSIArch Capital ACGLO WideScreen charts, DMA,SMA,EMA technical analysis, forecast prediction, by indicators ADX,MACD,RSI,CCI NASDAQ stock exchange
operates under Finance sector & deals in Property Casualty Insurers
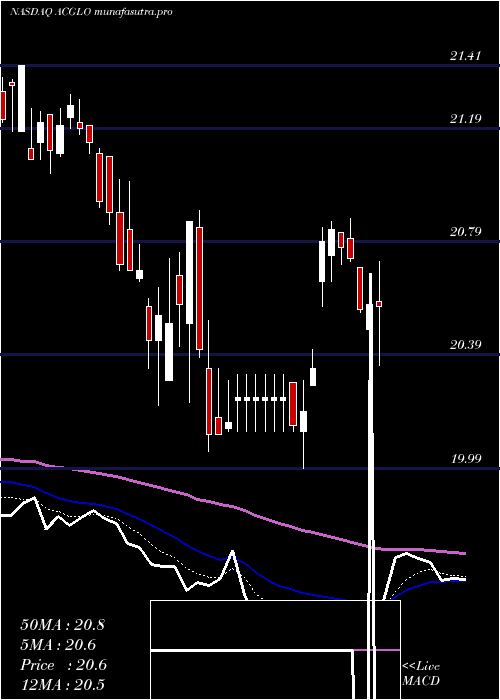
Daily price and charts and targets ArchCapital Strong Daily Stock price targets for ArchCapital ACGLO are 20.91 and 21.11 | Daily Target 1 | 20.85 | | Daily Target 2 | 20.96 | | Daily Target 3 | 21.053333333333 | | Daily Target 4 | 21.16 | | Daily Target 5 | 21.25 |
Daily price and volume Arch Capital
| Date |
Closing |
Open |
Range |
Volume |
Fri 05 December 2025 |
21.06 (-0.09%) |
21.15 |
20.95 - 21.15 |
0.6697 times |
Thu 04 December 2025 |
21.08 (0%) |
21.09 |
21.04 - 21.18 |
0.8289 times |
Wed 03 December 2025 |
21.08 (-0.28%) |
21.15 |
21.05 - 21.17 |
1.421 times |
Tue 02 December 2025 |
21.14 (0.05%) |
21.11 |
21.04 - 21.20 |
1.8375 times |
Mon 01 December 2025 |
21.13 (0.24%) |
21.11 |
21.00 - 21.18 |
0.8942 times |
Fri 28 November 2025 |
21.08 (0%) |
21.13 |
20.94 - 21.40 |
1.0657 times |
Wed 26 November 2025 |
21.08 (0.24%) |
21.07 |
20.82 - 21.11 |
0.5839 times |
Tue 25 November 2025 |
21.03 (0.38%) |
20.95 |
20.80 - 21.03 |
1.2617 times |
Mon 24 November 2025 |
20.95 (0.48%) |
20.83 |
20.73 - 20.98 |
0.8207 times |
Fri 21 November 2025 |
20.85 (0.53%) |
20.69 |
20.66 - 20.90 |
0.6166 times |
Thu 20 November 2025 |
20.74 (-1.24%) |
20.93 |
20.69 - 20.99 |
1.0331 times |
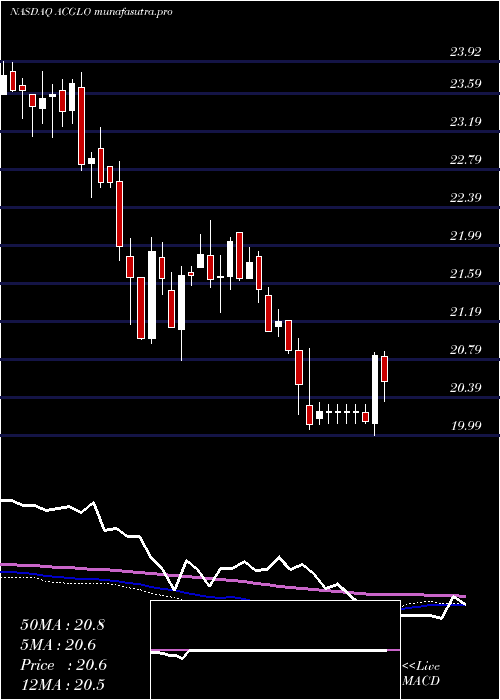
Weekly price and charts ArchCapital Strong weekly Stock price targets for ArchCapital ACGLO are 20.88 and 21.13 | Weekly Target 1 | 20.82 | | Weekly Target 2 | 20.94 | | Weekly Target 3 | 21.07 | | Weekly Target 4 | 21.19 | | Weekly Target 5 | 21.32 |
Weekly price and volumes for Arch Capital
| Date |
Closing |
Open |
Range |
Volume |
Fri 05 December 2025 |
21.06 (-0.09%) |
21.11 |
20.95 - 21.20 |
1.6237 times |
Fri 28 November 2025 |
21.08 (1.1%) |
20.83 |
20.73 - 21.40 |
1.0723 times |
Fri 21 November 2025 |
20.85 (-0.95%) |
21.05 |
20.66 - 21.10 |
1.2365 times |
Fri 14 November 2025 |
21.05 (-0.47%) |
21.16 |
20.82 - 21.29 |
1.1544 times |
Fri 07 November 2025 |
21.15 (-0.84%) |
21.25 |
21.08 - 21.41 |
0.7285 times |
Fri 31 October 2025 |
21.33 (0%) |
21.67 |
21.27 - 21.67 |
0.5056 times |
Fri 31 October 2025 |
21.33 (-2.34%) |
21.73 |
21.27 - 21.84 |
1.3632 times |
Fri 24 October 2025 |
21.84 (1.2%) |
21.58 |
21.58 - 21.85 |
0.7766 times |
Fri 17 October 2025 |
21.58 (-0.42%) |
21.75 |
21.51 - 21.85 |
0.9069 times |
Fri 10 October 2025 |
21.67 (-1.32%) |
21.98 |
21.61 - 22.06 |
0.6323 times |
Fri 03 October 2025 |
21.96 (1.1%) |
21.80 |
21.61 - 22.05 |
0.843 times |
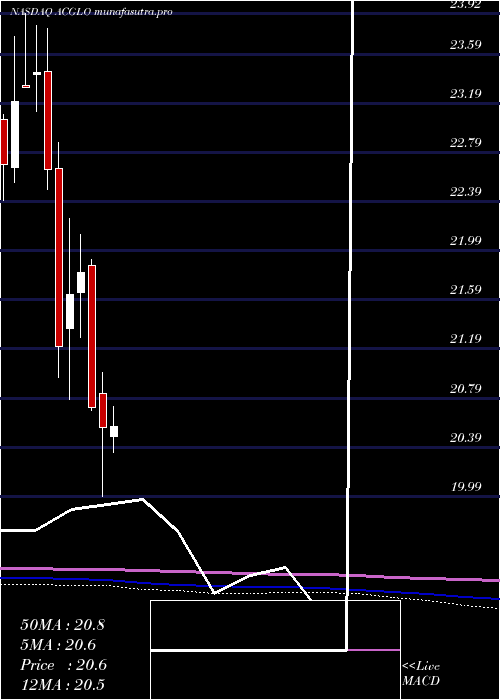
Monthly price and charts ArchCapital Strong monthly Stock price targets for ArchCapital ACGLO are 20.88 and 21.13 | Monthly Target 1 | 20.82 | | Monthly Target 2 | 20.94 | | Monthly Target 3 | 21.07 | | Monthly Target 4 | 21.19 | | Monthly Target 5 | 21.32 |
Monthly price and volumes Arch Capital
| Date |
Closing |
Open |
Range |
Volume |
Fri 05 December 2025 |
21.06 (-0.09%) |
21.11 |
20.95 - 21.20 |
0.329 times |
Fri 28 November 2025 |
21.08 (-1.17%) |
21.25 |
20.66 - 21.41 |
0.8494 times |
Fri 31 October 2025 |
21.33 (-2.2%) |
21.80 |
21.27 - 22.06 |
0.9384 times |
Tue 30 September 2025 |
21.81 (2.49%) |
21.28 |
21.26 - 22.20 |
0.8477 times |
Fri 29 August 2025 |
21.28 (2.7%) |
20.76 |
20.66 - 21.70 |
1.0474 times |
Thu 31 July 2025 |
20.72 (1.02%) |
20.60 |
20.35 - 20.88 |
1.0785 times |
Mon 30 June 2025 |
20.51 (0.34%) |
20.39 |
20.06 - 20.82 |
0.9908 times |
Fri 30 May 2025 |
20.44 (-0.54%) |
20.48 |
20.29 - 22.10 |
1.0343 times |
Wed 30 April 2025 |
20.55 (-0.77%) |
20.83 |
19.99 - 21.00 |
1.5717 times |
Mon 31 March 2025 |
20.71 (-5.04%) |
21.87 |
20.69 - 21.92 |
1.3126 times |
Fri 28 February 2025 |
21.81 (0.83%) |
21.65 |
21.28 - 22.12 |
0.7883 times |
DMA SMA EMA moving averages of Arch Capital ACGLO
DMA (daily moving average) of Arch Capital ACGLO
| DMA period | DMA value | | 5 day DMA | 21.1 | | 12 day DMA | 21.02 | | 20 day DMA | 21.03 | | 35 day DMA | 21.27 | | 50 day DMA | 21.43 | | 100 day DMA | 21.35 | | 150 day DMA | 21.07 | | 200 day DMA | 21.02 | EMA (exponential moving average) of Arch Capital ACGLO
| EMA period | EMA current | EMA prev | EMA prev2 | | 5 day EMA | 21.08 | 21.09 | 21.09 | | 12 day EMA | 21.07 | 21.07 | 21.07 | | 20 day EMA | 21.12 | 21.13 | 21.13 | | 35 day EMA | 21.25 | 21.26 | 21.27 | | 50 day EMA | 21.43 | 21.45 | 21.46 |
SMA (simple moving average) of Arch Capital ACGLO
| SMA period | SMA current | SMA prev | SMA prev2 | | 5 day SMA | 21.1 | 21.1 | 21.1 | | 12 day SMA | 21.02 | 21.01 | 21 | | 20 day SMA | 21.03 | 21.04 | 21.06 | | 35 day SMA | 21.27 | 21.28 | 21.3 | | 50 day SMA | 21.43 | 21.44 | 21.46 | | 100 day SMA | 21.35 | 21.35 | 21.34 | | 150 day SMA | 21.07 | 21.07 | 21.06 | | 200 day SMA | 21.02 | 21.03 | 21.03 |
|
|
