ArchCapital ACGL full analysis,charts,indicators,moving averages,SMA,DMA,EMA,ADX,MACD,RSIArch Capital ACGL WideScreen charts, DMA,SMA,EMA technical analysis, forecast prediction, by indicators ADX,MACD,RSI,CCI NASDAQ stock exchange
operates under Finance sector & deals in Property Casualty Insurers
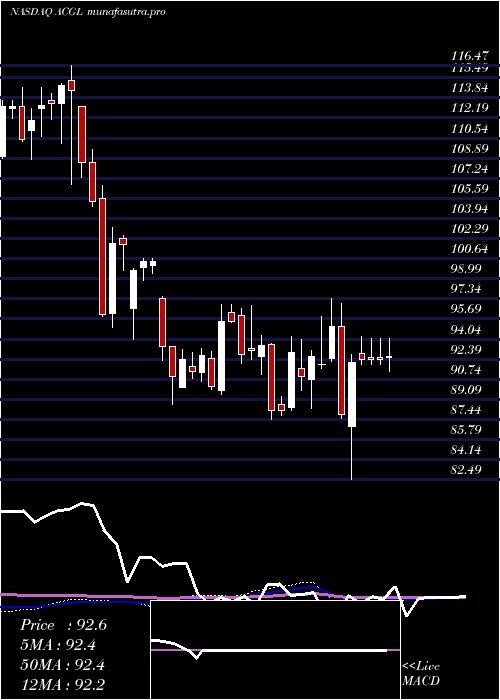
Daily price and charts and targets ArchCapital Strong Daily Stock price targets for ArchCapital ACGL are 90.98 and 91.95 | Daily Target 1 | 90.73 | | Daily Target 2 | 91.22 | | Daily Target 3 | 91.696666666667 | | Daily Target 4 | 92.19 | | Daily Target 5 | 92.67 |
Daily price and volume Arch Capital
| Date |
Closing |
Open |
Range |
Volume |
Fri 05 December 2025 |
91.72 (-0.73%) |
92.17 |
91.20 - 92.17 |
0.7997 times |
Thu 04 December 2025 |
92.39 (-0.36%) |
93.65 |
91.85 - 93.65 |
0.4385 times |
Wed 03 December 2025 |
92.72 (0.03%) |
92.87 |
92.06 - 93.79 |
1.3979 times |
Tue 02 December 2025 |
92.69 (-0.5%) |
92.96 |
91.93 - 93.43 |
1.2633 times |
Mon 01 December 2025 |
93.16 (-0.81%) |
94.00 |
92.69 - 94.54 |
0.9282 times |
Fri 28 November 2025 |
93.92 (-0.51%) |
94.46 |
93.90 - 94.94 |
0.5011 times |
Wed 26 November 2025 |
94.40 (0.84%) |
93.65 |
93.36 - 94.47 |
0.8865 times |
Tue 25 November 2025 |
93.61 (1.82%) |
93.01 |
92.78 - 93.96 |
1.0335 times |
Mon 24 November 2025 |
91.94 (-0.56%) |
92.46 |
91.23 - 92.56 |
1.8519 times |
Fri 21 November 2025 |
92.46 (0.63%) |
92.08 |
91.59 - 93.57 |
0.8995 times |
Thu 20 November 2025 |
91.88 (0.78%) |
91.53 |
91.27 - 92.27 |
0.9274 times |

Weekly price and charts ArchCapital Strong weekly Stock price targets for ArchCapital ACGL are 89.79 and 93.13 | Weekly Target 1 | 89.15 | | Weekly Target 2 | 90.43 | | Weekly Target 3 | 92.486666666667 | | Weekly Target 4 | 93.77 | | Weekly Target 5 | 95.83 |
Weekly price and volumes for Arch Capital
| Date |
Closing |
Open |
Range |
Volume |
Fri 05 December 2025 |
91.72 (-2.34%) |
94.00 |
91.20 - 94.54 |
0.9215 times |
Fri 28 November 2025 |
93.92 (1.58%) |
92.46 |
91.23 - 94.94 |
0.8157 times |
Fri 21 November 2025 |
92.46 (-0.06%) |
92.85 |
90.86 - 93.57 |
0.8054 times |
Fri 14 November 2025 |
92.52 (3.29%) |
88.78 |
88.64 - 93.58 |
1.1702 times |
Fri 07 November 2025 |
89.57 (3.78%) |
85.99 |
85.99 - 89.64 |
1.0818 times |
Fri 31 October 2025 |
86.31 (0%) |
85.83 |
85.68 - 87.00 |
0.2415 times |
Fri 31 October 2025 |
86.31 (-0.96%) |
87.00 |
82.44 - 87.62 |
1.5477 times |
Fri 24 October 2025 |
87.15 (0.74%) |
87.11 |
86.00 - 88.40 |
0.8364 times |
Fri 17 October 2025 |
86.51 (-6.45%) |
90.87 |
85.93 - 92.86 |
1.6733 times |
Fri 10 October 2025 |
92.47 (1.85%) |
91.03 |
90.86 - 94.81 |
0.9066 times |
Fri 03 October 2025 |
90.79 (-0.1%) |
90.87 |
88.77 - 91.53 |
0.7645 times |
Monthly price and charts ArchCapital Strong monthly Stock price targets for ArchCapital ACGL are 89.79 and 93.13 | Monthly Target 1 | 89.15 | | Monthly Target 2 | 90.43 | | Monthly Target 3 | 92.486666666667 | | Monthly Target 4 | 93.77 | | Monthly Target 5 | 95.83 |
Monthly price and volumes Arch Capital
| Date |
Closing |
Open |
Range |
Volume |
Fri 05 December 2025 |
91.72 (-2.34%) |
94.00 |
91.20 - 94.54 |
0.2297 times |
Fri 28 November 2025 |
93.92 (8.82%) |
85.99 |
85.99 - 94.94 |
0.9655 times |
Fri 31 October 2025 |
86.31 (-4.87%) |
90.24 |
82.44 - 94.81 |
1.4095 times |
Tue 30 September 2025 |
90.73 (-0.87%) |
91.74 |
87.01 - 93.80 |
1.2073 times |
Fri 29 August 2025 |
91.53 (6.36%) |
86.38 |
86.29 - 94.51 |
1.0626 times |
Thu 31 July 2025 |
86.06 (-5.48%) |
91.40 |
84.81 - 91.96 |
1.6839 times |
Mon 30 June 2025 |
91.05 (-4.2%) |
94.61 |
88.95 - 96.79 |
0.8073 times |
Fri 30 May 2025 |
95.04 (4.81%) |
90.13 |
89.17 - 95.83 |
0.8166 times |
Wed 30 April 2025 |
90.68 (-5.72%) |
96.01 |
82.49 - 96.92 |
0.9625 times |
Mon 31 March 2025 |
96.18 (3.52%) |
91.61 |
88.34 - 97.40 |
0.855 times |
Fri 28 February 2025 |
92.91 (-0.17%) |
92.57 |
87.42 - 94.30 |
0.971 times |

DMA SMA EMA moving averages of Arch Capital ACGL
DMA (daily moving average) of Arch Capital ACGL
| DMA period | DMA value | | 5 day DMA | 92.54 | | 12 day DMA | 92.67 | | 20 day DMA | 92.14 | | 35 day DMA | 89.86 | | 50 day DMA | 90.2 | | 100 day DMA | 89.99 | | 150 day DMA | 90.63 | | 200 day DMA | 90.93 | EMA (exponential moving average) of Arch Capital ACGL
| EMA period | EMA current | EMA prev | EMA prev2 | | 5 day EMA | 92.43 | 92.78 | 92.97 | | 12 day EMA | 92.36 | 92.48 | 92.5 | | 20 day EMA | 91.82 | 91.83 | 91.77 | | 35 day EMA | 91.27 | 91.24 | 91.17 | | 50 day EMA | 90.34 | 90.28 | 90.19 |
SMA (simple moving average) of Arch Capital ACGL
| SMA period | SMA current | SMA prev | SMA prev2 | | 5 day SMA | 92.54 | 92.98 | 93.38 | | 12 day SMA | 92.67 | 92.68 | 92.63 | | 20 day SMA | 92.14 | 91.94 | 91.7 | | 35 day SMA | 89.86 | 89.7 | 89.62 | | 50 day SMA | 90.2 | 90.16 | 90.13 | | 100 day SMA | 89.99 | 89.97 | 89.93 | | 150 day SMA | 90.63 | 90.62 | 90.61 | | 200 day SMA | 90.93 | 90.91 | 90.89 |
|
|
