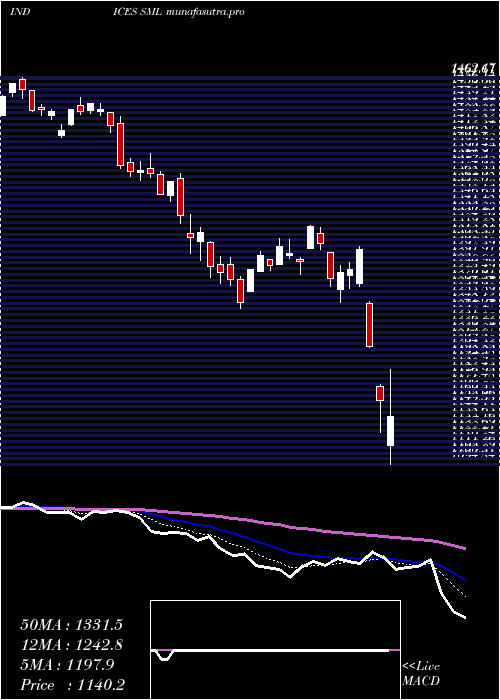
SP SML full analysis,charts,indicators,moving averages,SMA,DMA,EMA,ADX,MACD,RSIS P SML WideScreen charts, DMA,SMA,EMA technical analysis, forecast prediction, by indicators ADX,MACD,RSI,CCI INDICES stock exchange
Daily price and charts and targets SP Strong Daily Stock price targets for SP SML are 1479.58 and 1492.82 | Daily Target 1 | 1469.89 | | Daily Target 2 | 1476.03 | | Daily Target 3 | 1483.1266666667 | | Daily Target 4 | 1489.27 | | Daily Target 5 | 1496.37 |
Daily price and volume S P
| Date |
Closing |
Open |
Range |
Volume |
Thu 04 December 2025 |
1482.18 (-0.2%) |
1481.20 |
1476.98 - 1490.22 |
0.8454 times |
Wed 03 December 2025 |
1485.20 (1.45%) |
1468.15 |
1466.70 - 1486.40 |
0.9634 times |
Tue 02 December 2025 |
1463.92 (0.06%) |
1470.13 |
1460.73 - 1470.13 |
0.9364 times |
Mon 01 December 2025 |
1462.99 (-0.59%) |
1463.72 |
1456.81 - 1472.61 |
0.94 times |
Fri 28 November 2025 |
1471.61 (0.11%) |
1472.62 |
1468.59 - 1473.96 |
0.6415 times |
Wed 26 November 2025 |
1470.05 (0.51%) |
1460.74 |
1460.74 - 1485.75 |
1.2118 times |
Tue 25 November 2025 |
1462.61 (2.56%) |
1430.69 |
1430.69 - 1468.29 |
1.1278 times |
Mon 24 November 2025 |
1426.16 (1.3%) |
1408.31 |
1407.79 - 1428.78 |
1.1234 times |
Fri 21 November 2025 |
1407.83 (3.14%) |
1371.63 |
1370.65 - 1416.88 |
1.1332 times |
Thu 20 November 2025 |
1364.94 (-1.73%) |
1406.79 |
1364.24 - 1413.90 |
1.077 times |
Wed 19 November 2025 |
1388.96 (-0.14%) |
1393.83 |
1384.90 - 1404.14 |
0.9268 times |
Weekly price and charts SP Strong weekly Stock price targets for SP SML are 1469.5 and 1502.91 | Weekly Target 1 | 1442.99 | | Weekly Target 2 | 1462.59 | | Weekly Target 3 | 1476.4033333333 | | Weekly Target 4 | 1496 | | Weekly Target 5 | 1509.81 |
Weekly price and volumes for S P
| Date |
Closing |
Open |
Range |
Volume |
Thu 04 December 2025 |
1482.18 (0.72%) |
1463.72 |
1456.81 - 1490.22 |
0.8375 times |
Fri 28 November 2025 |
1471.61 (4.53%) |
1408.31 |
1407.79 - 1485.75 |
0.9328 times |
Fri 21 November 2025 |
1407.83 (-1.09%) |
1418.57 |
1364.24 - 1425.11 |
1.1629 times |
Fri 14 November 2025 |
1423.38 (-1%) |
1453.56 |
1406.65 - 1473.39 |
1.181 times |
Fri 07 November 2025 |
1437.82 (0.16%) |
1419.42 |
1414.68 - 1451.82 |
1.1494 times |
Fri 31 October 2025 |
1435.53 (0%) |
1431.22 |
1425.72 - 1438.54 |
0.2785 times |
Fri 31 October 2025 |
1435.53 (-2.84%) |
1486.76 |
1425.72 - 1488.40 |
1.2833 times |
Fri 24 October 2025 |
1477.54 (3.02%) |
1447.53 |
1440.36 - 1485.68 |
0.9899 times |
Fri 17 October 2025 |
1434.27 (2.98%) |
1404.16 |
1402.71 - 1466.82 |
1.0725 times |
Fri 10 October 2025 |
1392.72 (-4.94%) |
1475.80 |
1392.17 - 1477.20 |
1.1123 times |
Fri 03 October 2025 |
1465.17 (1.27%) |
1454.16 |
1435.26 - 1480.13 |
0.9129 times |

Monthly price and charts SP Strong monthly Stock price targets for SP SML are 1469.5 and 1502.91 | Monthly Target 1 | 1442.99 | | Monthly Target 2 | 1462.59 | | Monthly Target 3 | 1476.4033333333 | | Monthly Target 4 | 1496 | | Monthly Target 5 | 1509.81 |
Monthly price and volumes S P
| Date |
Closing |
Open |
Range |
Volume |
Thu 04 December 2025 |
1482.18 (0.72%) |
1463.72 |
1456.81 - 1490.22 |
0.2206 times |
Fri 28 November 2025 |
1471.61 (2.51%) |
1419.42 |
1364.24 - 1485.75 |
1.1656 times |
Fri 31 October 2025 |
1435.53 (-0.95%) |
1446.49 |
1392.17 - 1488.40 |
1.3663 times |
Tue 30 September 2025 |
1449.29 (0.8%) |
1419.02 |
1414.80 - 1476.23 |
1.266 times |
Fri 29 August 2025 |
1437.77 (6.89%) |
1330.13 |
1307.07 - 1450.14 |
1.2049 times |
Thu 31 July 2025 |
1345.10 (0.62%) |
1380.60 |
1341.59 - 1383.52 |
0.2291 times |
Fri 27 June 2025 |
1336.86 (4.09%) |
1282.94 |
1264.38 - 1344.48 |
1.0778 times |
Fri 30 May 2025 |
1284.30 (5.07%) |
1229.66 |
1219.42 - 1323.85 |
1.2518 times |
Wed 30 April 2025 |
1222.38 (-4.28%) |
1274.36 |
1089.63 - 1301.47 |
1.1616 times |
Mon 31 March 2025 |
1277.06 (-6.36%) |
1366.33 |
1243.21 - 1371.65 |
1.0563 times |
Fri 28 February 2025 |
1363.73 (-5.84%) |
1415.55 |
1344.34 - 1462.17 |
0.9945 times |
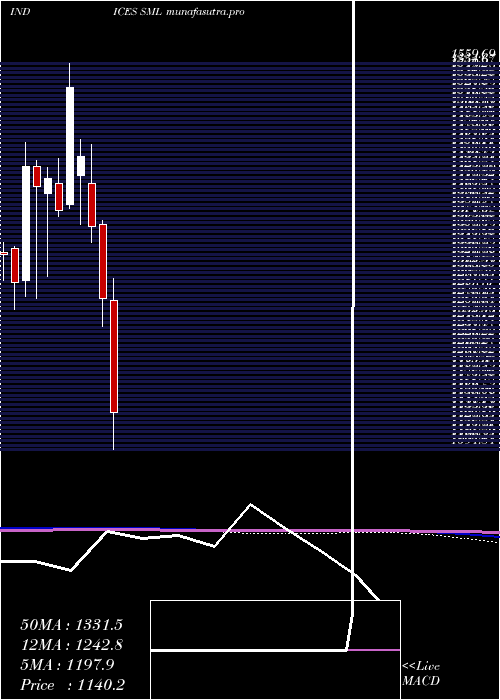
DMA SMA EMA moving averages of S P SML
DMA (daily moving average) of S P SML
| DMA period | DMA value | | 5 day DMA | 1473.18 | | 12 day DMA | 1439.77 | | 20 day DMA | 1437.25 | | 35 day DMA | 1442.64 | | 50 day DMA | 1442.74 | | 100 day DMA | 1418.62 | | 150 day DMA | 1364.08 | | 200 day DMA | 1369.38 | EMA (exponential moving average) of S P SML
| EMA period | EMA current | EMA prev | EMA prev2 | | 5 day EMA | 1472.01 | 1466.93 | 1457.79 | | 12 day EMA | 1454.73 | 1449.74 | 1443.29 | | 20 day EMA | 1447.44 | 1443.79 | 1439.43 | | 35 day EMA | 1444.36 | 1442.13 | 1439.59 | | 50 day EMA | 1447 | 1445.56 | 1443.94 |
SMA (simple moving average) of S P SML
| SMA period | SMA current | SMA prev | SMA prev2 | | 5 day SMA | 1473.18 | 1470.75 | 1466.24 | | 12 day SMA | 1439.77 | 1432.25 | 1427.1 | | 20 day SMA | 1437.25 | 1435.44 | 1432.21 | | 35 day SMA | 1442.64 | 1441.85 | 1440.63 | | 50 day SMA | 1442.74 | 1442.22 | 1441.71 | | 100 day SMA | 1418.62 | 1417 | 1415.39 | | 150 day SMA | 1364.08 | 1362.9 | 1361.81 | | 200 day SMA | 1369.38 | 1369.03 | 1368.65 |
|
|
