YtdLows MYLL full analysis,charts,indicators,moving averages,SMA,DMA,EMA,ADX,MACD,RSIYtd Lows MYLL WideScreen charts, DMA,SMA,EMA technical analysis, forecast prediction, by indicators ADX,MACD,RSI,CCI INDICES stock exchange
Daily price and charts and targets YtdLows Strong Daily Stock price targets for YtdLows MYLL are 50 and 50 | Daily Target 1 | 50 | | Daily Target 2 | 50 | | Daily Target 3 | 50 | | Daily Target 4 | 50 | | Daily Target 5 | 50 |
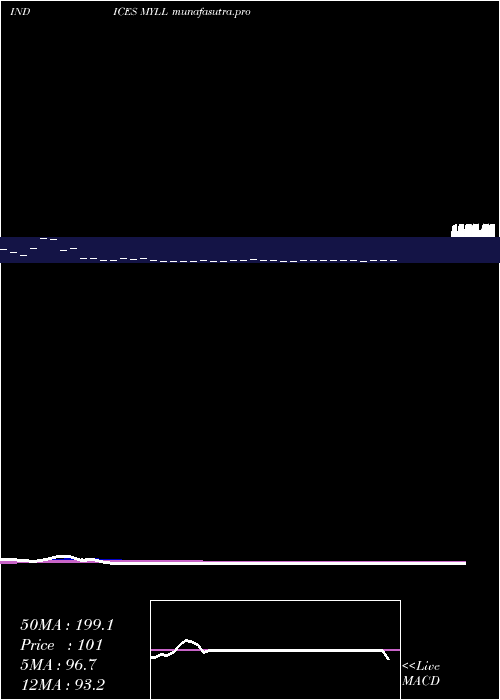
Daily price and volume Ytd Lows
| Date |
Closing |
Open |
Range |
Volume |
Mon 20 October 2025 |
50.00 (-45.65%) |
50.00 |
50.00 - 50.00 |
1.0034 times |
Fri 17 October 2025 |
92.00 (35.29%) |
92.00 |
92.00 - 92.00 |
0.9919 times |
Thu 16 October 2025 |
68.00 (106.06%) |
68.00 |
68.00 - 68.00 |
0.998 times |
Wed 15 October 2025 |
33.00 (-57.14%) |
33.00 |
33.00 - 33.00 |
1.0071 times |
Tue 14 October 2025 |
77.00 (-17.2%) |
77.00 |
77.00 - 77.00 |
1.0192 times |
Mon 13 October 2025 |
93.00 (-12.26%) |
93.00 |
93.00 - 93.00 |
0.984 times |
Fri 10 October 2025 |
106.00 (130.43%) |
106.00 |
106.00 - 106.00 |
1.0165 times |
Thu 09 October 2025 |
46.00 (9.52%) |
46.00 |
46.00 - 46.00 |
0.9925 times |
Wed 08 October 2025 |
42.00 (-12.5%) |
42.00 |
42.00 - 42.00 |
0.9919 times |
Tue 07 October 2025 |
48.00 (23.08%) |
48.00 |
48.00 - 48.00 |
0.9955 times |
Mon 06 October 2025 |
39.00 (50%) |
39.00 |
39.00 - 39.00 |
0.9952 times |
Weekly price and charts YtdLows Strong weekly Stock price targets for YtdLows MYLL are 50 and 50 | Weekly Target 1 | 50 | | Weekly Target 2 | 50 | | Weekly Target 3 | 50 | | Weekly Target 4 | 50 | | Weekly Target 5 | 50 |
Weekly price and volumes for Ytd Lows
| Date |
Closing |
Open |
Range |
Volume |
Mon 20 October 2025 |
50.00 (-45.65%) |
50.00 |
50.00 - 50.00 |
0.2544 times |
Fri 17 October 2025 |
92.00 (-13.21%) |
93.00 |
33.00 - 93.00 |
1.2675 times |
Fri 10 October 2025 |
106.00 (307.69%) |
39.00 |
39.00 - 106.00 |
1.2654 times |
Fri 03 October 2025 |
26.00 (-46.94%) |
67.00 |
26.00 - 76.00 |
1.0049 times |
Fri 26 September 2025 |
49.00 (28.95%) |
38.00 |
38.00 - 67.00 |
1.2525 times |
Fri 19 September 2025 |
38.00 (22.58%) |
45.00 |
30.00 - 45.00 |
1.2531 times |
Fri 12 September 2025 |
31.00 (-55.07%) |
71.00 |
31.00 - 71.00 |
1.236 times |
Fri 05 September 2025 |
69.00 (35.29%) |
85.00 |
69.00 - 94.00 |
0.9872 times |
Fri 29 August 2025 |
51.00 (0%) |
51.00 |
51.00 - 51.00 |
0.2466 times |
Fri 29 August 2025 |
51.00 (30.77%) |
37.00 |
29.00 - 51.00 |
1.2324 times |
Fri 22 August 2025 |
39.00 (-48%) |
57.00 |
39.00 - 114.00 |
1.2232 times |

Monthly price and charts YtdLows Strong monthly Stock price targets for YtdLows MYLL are 38 and 118 | Monthly Target 1 | -19.33 | | Monthly Target 2 | 15.33 | | Monthly Target 3 | 60.666666666667 | | Monthly Target 4 | 95.33 | | Monthly Target 5 | 140.67 |
Monthly price and volumes Ytd Lows
| Date |
Closing |
Open |
Range |
Volume |
Mon 20 October 2025 |
50.00 (-34.21%) |
49.00 |
26.00 - 106.00 |
0.665 times |
Tue 30 September 2025 |
76.00 (49.02%) |
85.00 |
30.00 - 94.00 |
1.0572 times |
Fri 29 August 2025 |
51.00 (-57.85%) |
175.00 |
29.00 - 175.00 |
1.0445 times |
Thu 31 July 2025 |
121.00 (57.14%) |
61.00 |
12.00 - 121.00 |
1.0884 times |
Mon 30 June 2025 |
77.00 (-14.44%) |
92.00 |
35.00 - 138.00 |
0.9525 times |
Fri 30 May 2025 |
90.00 (-9.09%) |
68.00 |
48.00 - 128.00 |
1.1562 times |
Wed 30 April 2025 |
99.00 (-86.46%) |
563.00 |
42.00 - 1351.00 |
1.037 times |
Mon 31 March 2025 |
731.00 (12.29%) |
771.00 |
145.00 - 1015.00 |
0.9611 times |
Fri 28 February 2025 |
651.00 (130.85%) |
589.00 |
151.00 - 682.00 |
0.9451 times |
Fri 31 January 2025 |
282.00 (347.62%) |
0.01 |
0.01 - 1196.00 |
1.0929 times |
Tue 31 December 2024 |
63.00 (-25.88%) |
77.00 |
49.00 - 252.00 |
0.8841 times |

DMA SMA EMA moving averages of Ytd Lows MYLL
DMA (daily moving average) of Ytd Lows MYLL
| DMA period | DMA value | | 5 day DMA | 64 | | 12 day DMA | 60 | | 20 day DMA | 57.75 | | 35 day DMA | 55.83 | | 50 day DMA | 58.86 | | 100 day DMA | 60.59 | | 150 day DMA | 121.52 | | 200 day DMA | 199.45 | EMA (exponential moving average) of Ytd Lows MYLL
| EMA period | EMA current | EMA prev | EMA prev2 | | 5 day EMA | 65.33 | 72.99 | 63.49 | | 12 day EMA | 63.01 | 65.38 | 60.54 | | 20 day EMA | 60.61 | 61.73 | 58.55 | | 35 day EMA | 62.23 | 62.95 | 61.24 | | 50 day EMA | 63.47 | 64.02 | 62.88 |
SMA (simple moving average) of Ytd Lows MYLL
| SMA period | SMA current | SMA prev | SMA prev2 | | 5 day SMA | 64 | 72.6 | 75.4 | | 12 day SMA | 60 | 59.92 | 58.58 | | 20 day SMA | 57.75 | 57.15 | 54.05 | | 35 day SMA | 55.83 | 55.86 | 54.49 | | 50 day SMA | 58.86 | 59.84 | 60.14 | | 100 day SMA | 60.59 | 61.1 | 61.39 | | 150 day SMA | 121.52 | 123.27 | 126.46 | | 200 day SMA | 199.45 | 199.81 | 199.68 |
|
|
