YtdLows MYLA full analysis,charts,indicators,moving averages,SMA,DMA,EMA,ADX,MACD,RSIYtd Lows MYLA WideScreen charts, DMA,SMA,EMA technical analysis, forecast prediction, by indicators ADX,MACD,RSI,CCI INDICES stock exchange
Daily price and charts and targets YtdLows Strong Daily Stock price targets for YtdLows MYLA are 3 and 3 | Daily Target 1 | 3 | | Daily Target 2 | 3 | | Daily Target 3 | 3 | | Daily Target 4 | 3 | | Daily Target 5 | 3 |
Daily price and volume Ytd Lows
| Date |
Closing |
Open |
Range |
Volume |
Tue 21 October 2025 |
3.00 (-25%) |
3.00 |
3.00 - 3.00 |
0.8287 times |
Tue 21 October 2025 |
4.00 (33.33%) |
4.00 |
4.00 - 4.00 |
1.0676 times |
Mon 20 October 2025 |
3.00 (-62.5%) |
3.00 |
3.00 - 3.00 |
0.8846 times |
Mon 20 October 2025 |
8.00 (166.67%) |
8.00 |
8.00 - 8.00 |
1.0829 times |
Fri 17 October 2025 |
3.00 (-66.67%) |
3.00 |
3.00 - 3.00 |
0.9202 times |
Fri 17 October 2025 |
9.00 (89900%) |
9.00 |
9.00 - 9.00 |
1.088 times |
Thu 16 October 2025 |
0.01 (-99.83%) |
0.01 |
0.01 - 0.01 |
0.8439 times |
Thu 16 October 2025 |
6.00 (200%) |
6.00 |
6.00 - 6.00 |
1.093 times |
Wed 15 October 2025 |
2.00 (0%) |
2.00 |
2.00 - 2.00 |
1.093 times |
Wed 15 October 2025 |
2.00 (-50%) |
2.00 |
2.00 - 2.00 |
1.0981 times |
Tue 14 October 2025 |
4.00 (-20%) |
4.00 |
4.00 - 4.00 |
0.8744 times |
Weekly price and charts YtdLows Strong weekly Stock price targets for YtdLows MYLA are 3 and 3 | Weekly Target 1 | 3 | | Weekly Target 2 | 3 | | Weekly Target 3 | 3 | | Weekly Target 4 | 3 | | Weekly Target 5 | 3 |
Weekly price and volumes for Ytd Lows
| Date |
Closing |
Open |
Range |
Volume |
Tue 21 October 2025 |
3.00 (-25%) |
3.00 |
3.00 - 3.00 |
0.3622 times |
Tue 21 October 2025 |
4.00 (-50%) |
3.00 |
3.00 - 4.00 |
0.8533 times |
Mon 20 October 2025 |
8.00 (166.67%) |
8.00 |
8.00 - 8.00 |
0.4733 times |
Fri 17 October 2025 |
3.00 (-66.67%) |
3.00 |
3.00 - 3.00 |
0.4022 times |
Fri 17 October 2025 |
9.00 (50%) |
0.01 |
0.01 - 9.00 |
0.8444 times |
Thu 16 October 2025 |
6.00 (200%) |
2.00 |
2.00 - 6.00 |
0.9556 times |
Wed 15 October 2025 |
2.00 (-60%) |
4.00 |
2.00 - 4.00 |
0.8622 times |
Tue 14 October 2025 |
5.00 (66.67%) |
5.00 |
5.00 - 5.00 |
0.9667 times |
Fri 10 October 2025 |
3.00 (29900%) |
0.01 |
0.01 - 3.00 |
2.3844 times |
Fri 03 October 2025 |
0.01 (-99.5%) |
4.00 |
0.01 - 7.00 |
1.8956 times |
Fri 26 September 2025 |
2.00 (19900%) |
1.00 |
1.00 - 7.00 |
2.3622 times |

Monthly price and charts YtdLows Strong monthly Stock price targets for YtdLows MYLA are -2.99 and 6 | Monthly Target 1 | -4.99 | | Monthly Target 2 | -0.99 | | Monthly Target 3 | 4.0033333333333 | | Monthly Target 4 | 8 | | Monthly Target 5 | 12.99 |
Monthly price and volumes Ytd Lows
| Date |
Closing |
Open |
Range |
Volume |
Tue 21 October 2025 |
3.00 (-57.14%) |
4.00 |
0.01 - 9.00 |
0.9544 times |
Tue 30 September 2025 |
7.00 (250%) |
4.00 |
0.01 - 7.00 |
1.0346 times |
Fri 29 August 2025 |
2.00 (-66.67%) |
10.00 |
0.01 - 10.00 |
1.0142 times |
Thu 31 July 2025 |
6.00 (-14.29%) |
6.00 |
0.01 - 6.00 |
1.0739 times |
Mon 30 June 2025 |
7.00 (-12.5%) |
6.00 |
2.00 - 7.00 |
0.9317 times |
Fri 30 May 2025 |
8.00 (14.29%) |
3.00 |
1.00 - 13.00 |
1.114 times |
Wed 30 April 2025 |
7.00 (-79.41%) |
30.00 |
3.00 - 94.00 |
0.9629 times |
Mon 31 March 2025 |
34.00 (-8.11%) |
48.00 |
4.00 - 69.00 |
0.9186 times |
Fri 28 February 2025 |
37.00 (105.56%) |
41.00 |
9.00 - 51.00 |
0.9059 times |
Fri 31 January 2025 |
18.00 (500%) |
0.01 |
0.01 - 90.00 |
1.0898 times |
Tue 31 December 2024 |
3.00 (0%) |
6.00 |
0.01 - 13.00 |
0.8603 times |

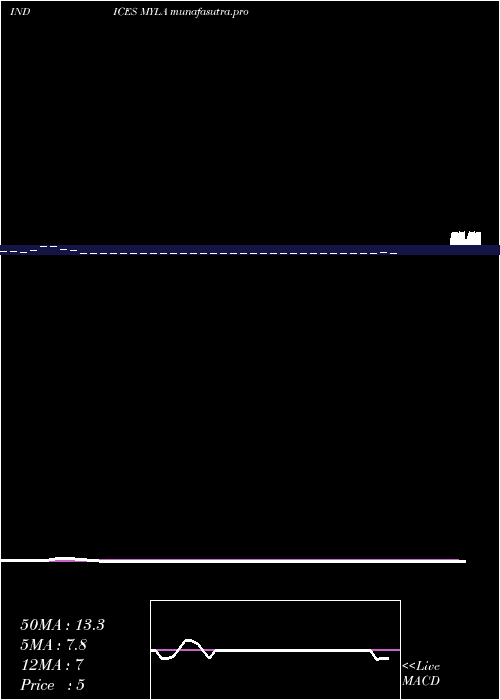
DMA SMA EMA moving averages of Ytd Lows MYLA
DMA (daily moving average) of Ytd Lows MYLA
| DMA period | DMA value | | 5 day DMA | 4.2 | | 12 day DMA | 4.08 | | 20 day DMA | 3.45 | | 35 day DMA | 2.92 | | 50 day DMA | 2.84 | | 100 day DMA | 3.28 | | 150 day DMA | 6.81 | | 200 day DMA | 12.07 | EMA (exponential moving average) of Ytd Lows MYLA
| EMA period | EMA current | EMA prev | EMA prev2 | | 5 day EMA | 3.95 | 4.42 | 4.63 | | 12 day EMA | 3.97 | 4.15 | 4.18 | | 20 day EMA | 3.73 | 3.81 | 3.79 | | 35 day EMA | 3.43 | 3.46 | 3.43 | | 50 day EMA | 3.17 | 3.18 | 3.15 |
SMA (simple moving average) of Ytd Lows MYLA
| SMA period | SMA current | SMA prev | SMA prev2 | | 5 day SMA | 4.2 | 5.4 | 4.6 | | 12 day SMA | 4.08 | 4.25 | 4.17 | | 20 day SMA | 3.45 | 3.65 | 3.65 | | 35 day SMA | 2.92 | 2.86 | 2.83 | | 50 day SMA | 2.84 | 2.92 | 2.92 | | 100 day SMA | 3.28 | 3.31 | 3.31 | | 150 day SMA | 6.81 | 6.93 | 6.93 | | 200 day SMA | 12.07 | 12.5 | 12.93 |
|
|
