YtdHighs MYHE full analysis,charts,indicators,moving averages,SMA,DMA,EMA,ADX,MACD,RSIYtd Highs MYHE WideScreen charts, DMA,SMA,EMA technical analysis, forecast prediction, by indicators ADX,MACD,RSI,CCI INDICES stock exchange
Daily price and charts and targets YtdHighs Strong Daily Stock price targets for YtdHighs MYHE are 100 and 100 | Daily Target 1 | 100 | | Daily Target 2 | 100 | | Daily Target 3 | 100 | | Daily Target 4 | 100 | | Daily Target 5 | 100 |
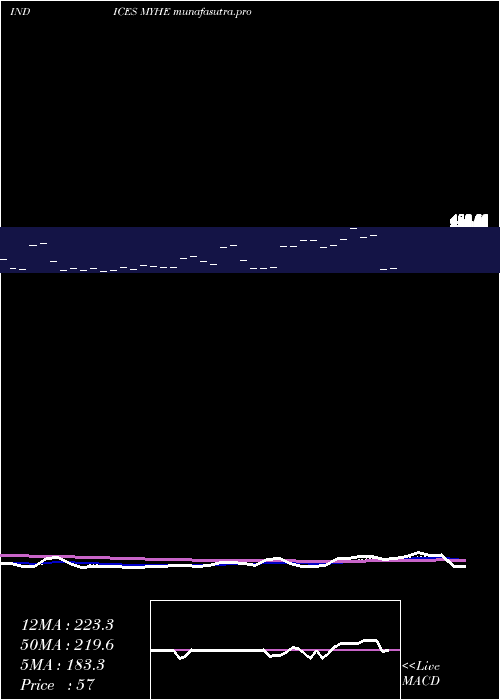
Daily price and volume Ytd Highs
| Date |
Closing |
Open |
Range |
Volume |
Mon 20 October 2025 |
100.00 (-80.62%) |
100.00 |
100.00 - 100.00 |
0.6282 times |
Mon 20 October 2025 |
516.00 (1884.62%) |
516.00 |
516.00 - 516.00 |
1.2534 times |
Fri 17 October 2025 |
26.00 (-67.9%) |
26.00 |
26.00 - 26.00 |
0.602 times |
Fri 17 October 2025 |
81.00 (-10.99%) |
81.00 |
81.00 - 81.00 |
1.2393 times |
Thu 16 October 2025 |
91.00 (-69.87%) |
91.00 |
91.00 - 91.00 |
0.6148 times |
Thu 16 October 2025 |
302.00 (11.03%) |
302.00 |
302.00 - 302.00 |
1.2773 times |
Wed 15 October 2025 |
272.00 (-2.16%) |
272.00 |
272.00 - 272.00 |
1.2558 times |
Wed 15 October 2025 |
278.00 (1637.5%) |
278.00 |
278.00 - 278.00 |
1.2629 times |
Tue 14 October 2025 |
16.00 (-89.68%) |
16.00 |
16.00 - 16.00 |
0.5983 times |
Tue 14 October 2025 |
155.00 (70.33%) |
155.00 |
155.00 - 155.00 |
1.2679 times |
Mon 13 October 2025 |
91.00 (-70.83%) |
91.00 |
91.00 - 91.00 |
1.2457 times |
Weekly price and charts YtdHighs Strong weekly Stock price targets for YtdHighs MYHE are 100 and 100 | Weekly Target 1 | 100 | | Weekly Target 2 | 100 | | Weekly Target 3 | 100 | | Weekly Target 4 | 100 | | Weekly Target 5 | 100 |
Weekly price and volumes for Ytd Highs
| Date |
Closing |
Open |
Range |
Volume |
Mon 20 October 2025 |
100.00 (-80.62%) |
100.00 |
100.00 - 100.00 |
0.2205 times |
Mon 20 October 2025 |
516.00 (1884.62%) |
516.00 |
516.00 - 516.00 |
0.4399 times |
Fri 17 October 2025 |
26.00 (-67.9%) |
26.00 |
26.00 - 26.00 |
0.2113 times |
Fri 17 October 2025 |
81.00 (-73.18%) |
91.00 |
81.00 - 91.00 |
0.6506 times |
Thu 16 October 2025 |
302.00 (8.63%) |
272.00 |
272.00 - 302.00 |
0.8889 times |
Wed 15 October 2025 |
278.00 (79.35%) |
16.00 |
16.00 - 278.00 |
0.6531 times |
Tue 14 October 2025 |
155.00 (-50.32%) |
91.00 |
91.00 - 155.00 |
0.8821 times |
Fri 10 October 2025 |
312.00 (-71.51%) |
980.00 |
312.00 - 980.00 |
2.1991 times |
Fri 03 October 2025 |
1095.00 (869.03%) |
302.00 |
302.00 - 1095.00 |
1.7251 times |
Fri 26 September 2025 |
113.00 (-85.38%) |
850.00 |
45.00 - 850.00 |
2.1294 times |
Fri 19 September 2025 |
773.00 (17.66%) |
1216.00 |
773.00 - 1216.00 |
2.1373 times |

Monthly price and charts YtdHighs Strong monthly Stock price targets for YtdHighs MYHE are -481.5 and 597.5 | Monthly Target 1 | -675.33 | | Monthly Target 2 | -287.67 | | Monthly Target 3 | 403.66666666667 | | Monthly Target 4 | 791.33 | | Monthly Target 5 | 1482.67 |
Monthly price and volumes Ytd Highs
| Date |
Closing |
Open |
Range |
Volume |
Mon 20 October 2025 |
100.00 (-69.97%) |
812.00 |
16.00 - 1095.00 |
0.8689 times |
Tue 30 September 2025 |
333.00 (12.5%) |
99.00 |
45.00 - 1500.00 |
1.1073 times |
Fri 29 August 2025 |
296.00 (-31%) |
67.00 |
53.00 - 1235.00 |
1.0746 times |
Thu 31 July 2025 |
429.00 (-46.91%) |
530.00 |
81.00 - 985.00 |
1.1092 times |
Mon 30 June 2025 |
808.00 (1453.85%) |
325.00 |
54.00 - 808.00 |
0.9291 times |
Fri 30 May 2025 |
52.00 (-57.02%) |
91.00 |
47.00 - 434.00 |
1.1123 times |
Wed 30 April 2025 |
121.00 (-12.95%) |
57.00 |
26.00 - 295.00 |
0.9833 times |
Mon 31 March 2025 |
139.00 (-68.9%) |
507.00 |
34.00 - 507.00 |
0.9079 times |
Fri 28 February 2025 |
447.00 (-48.08%) |
176.00 |
176.00 - 1150.00 |
0.8905 times |
Fri 31 January 2025 |
861.00 (7075%) |
0.01 |
0.01 - 2392.00 |
1.0167 times |
Tue 31 December 2024 |
12.00 (-96.19%) |
211.00 |
6.00 - 311.00 |
0.7957 times |

DMA SMA EMA moving averages of Ytd Highs MYHE
DMA (daily moving average) of Ytd Highs MYHE
| DMA period | DMA value | | 5 day DMA | 162.8 | | 12 day DMA | 186.67 | | 20 day DMA | 354.2 | | 35 day DMA | 521.34 | | 50 day DMA | 482.46 | | 100 day DMA | 447.4 | | 150 day DMA | 347.06 | | 200 day DMA | 406.85 | EMA (exponential moving average) of Ytd Highs MYHE
| EMA period | EMA current | EMA prev | EMA prev2 | | 5 day EMA | 199.96 | 249.93 | 116.92 | | 12 day EMA | 243.46 | 269.54 | 224.74 | | 20 day EMA | 311.53 | 333.79 | 314.62 | | 35 day EMA | 388.04 | 405 | 398.47 | | 50 day EMA | 461.97 | 476.74 | 475.14 |
SMA (simple moving average) of Ytd Highs MYHE
| SMA period | SMA current | SMA prev | SMA prev2 | | 5 day SMA | 162.8 | 203.2 | 154.4 | | 12 day SMA | 186.67 | 213.83 | 212.83 | | 20 day SMA | 354.2 | 354.85 | 331.3 | | 35 day SMA | 521.34 | 547.63 | 544.74 | | 50 day SMA | 482.46 | 488.58 | 483.96 | | 100 day SMA | 447.4 | 449.65 | 445.01 | | 150 day SMA | 347.06 | 348.17 | 346.13 | | 200 day SMA | 406.85 | 410.03 | 419.41 |
|
|
