12Month MAHA full analysis,charts,indicators,moving averages,SMA,DMA,EMA,ADX,MACD,RSI12 Month MAHA WideScreen charts, DMA,SMA,EMA technical analysis, forecast prediction, by indicators ADX,MACD,RSI,CCI INDICES stock exchange
Daily price and charts and targets 12Month Strong Daily Stock price targets for 12Month MAHA are 1 and 1 | Daily Target 1 | 1 | | Daily Target 2 | 1 | | Daily Target 3 | 1 | | Daily Target 4 | 1 | | Daily Target 5 | 1 |
Daily price and volume 12 Month
| Date |
Closing |
Open |
Range |
Volume |
Mon 20 October 2025 |
1.00 (-50%) |
1.00 |
1.00 - 1.00 |
0.8775 times |
Mon 20 October 2025 |
2.00 (19900%) |
2.00 |
2.00 - 2.00 |
1.0741 times |
Fri 17 October 2025 |
0.01 (-99%) |
0.01 |
0.01 - 0.01 |
0.9128 times |
Fri 17 October 2025 |
1.00 (-93.33%) |
1.00 |
1.00 - 1.00 |
1.0792 times |
Thu 16 October 2025 |
15.00 (-25%) |
15.00 |
15.00 - 15.00 |
0.8371 times |
Thu 16 October 2025 |
20.00 (-25.93%) |
20.00 |
20.00 - 20.00 |
1.0842 times |
Wed 15 October 2025 |
27.00 (0%) |
27.00 |
27.00 - 27.00 |
1.0842 times |
Wed 15 October 2025 |
27.00 (350%) |
27.00 |
27.00 - 27.00 |
1.0893 times |
Tue 14 October 2025 |
6.00 (-71.43%) |
6.00 |
6.00 - 6.00 |
0.8674 times |
Tue 14 October 2025 |
21.00 (16.67%) |
21.00 |
21.00 - 21.00 |
1.0943 times |
Mon 13 October 2025 |
18.00 (38.46%) |
18.00 |
18.00 - 18.00 |
1.0993 times |
Weekly price and charts 12Month Strong weekly Stock price targets for 12Month MAHA are 1 and 1 | Weekly Target 1 | 1 | | Weekly Target 2 | 1 | | Weekly Target 3 | 1 | | Weekly Target 4 | 1 | | Weekly Target 5 | 1 |
Weekly price and volumes for 12 Month
| Date |
Closing |
Open |
Range |
Volume |
Mon 20 October 2025 |
1.00 (-50%) |
1.00 |
1.00 - 1.00 |
0.3353 times |
Mon 20 October 2025 |
2.00 (19900%) |
2.00 |
2.00 - 2.00 |
0.4104 times |
Fri 17 October 2025 |
0.01 (-99%) |
0.01 |
0.01 - 0.01 |
0.3487 times |
Fri 17 October 2025 |
1.00 (-95%) |
15.00 |
1.00 - 15.00 |
0.7322 times |
Thu 16 October 2025 |
20.00 (-25.93%) |
27.00 |
20.00 - 27.00 |
0.8285 times |
Wed 15 October 2025 |
27.00 (28.57%) |
6.00 |
6.00 - 27.00 |
0.7476 times |
Tue 14 October 2025 |
21.00 (61.54%) |
18.00 |
18.00 - 21.00 |
0.8382 times |
Fri 10 October 2025 |
13.00 (18.18%) |
25.00 |
13.00 - 28.00 |
2.0674 times |
Fri 03 October 2025 |
11.00 (-47.62%) |
24.00 |
8.00 - 24.00 |
1.6435 times |
Fri 26 September 2025 |
21.00 (5%) |
28.00 |
9.00 - 34.00 |
2.0482 times |
Fri 19 September 2025 |
20.00 (0%) |
27.00 |
5.00 - 27.00 |
2.0308 times |
Monthly price and charts 12Month Strong monthly Stock price targets for 12Month MAHA are -13.49 and 14.5 | Monthly Target 1 | -18.32 | | Monthly Target 2 | -8.66 | | Monthly Target 3 | 9.67 | | Monthly Target 4 | 19.33 | | Monthly Target 5 | 37.66 |
Monthly price and volumes 12 Month
| Date |
Closing |
Open |
Range |
Volume |
Mon 20 October 2025 |
1.00 (-87.5%) |
19.00 |
0.01 - 28.00 |
0.8747 times |
Tue 30 September 2025 |
8.00 (-63.64%) |
24.00 |
5.00 - 34.00 |
1.0437 times |
Fri 29 August 2025 |
22.00 (2100%) |
1.00 |
1.00 - 22.00 |
1.0231 times |
Thu 31 July 2025 |
1.00 (-75%) |
8.00 |
1.00 - 15.00 |
1.0834 times |
Mon 30 June 2025 |
4.00 (100%) |
13.00 |
2.00 - 17.00 |
0.9399 times |
Fri 30 May 2025 |
2.00 (-66.67%) |
2.00 |
1.00 - 8.00 |
1.1238 times |
Wed 30 April 2025 |
6.00 (100%) |
1.00 |
0.01 - 13.00 |
0.9714 times |
Mon 31 March 2025 |
3.00 (200%) |
1.00 |
0.01 - 5.00 |
0.9267 times |
Fri 28 February 2025 |
1.00 (-66.67%) |
4.00 |
0.01 - 6.00 |
0.9139 times |
Fri 31 January 2025 |
3.00 (-50%) |
8.00 |
1.00 - 12.00 |
1.0995 times |
Tue 31 December 2024 |
6.00 (50%) |
2.00 |
1.00 - 8.00 |
0.8678 times |
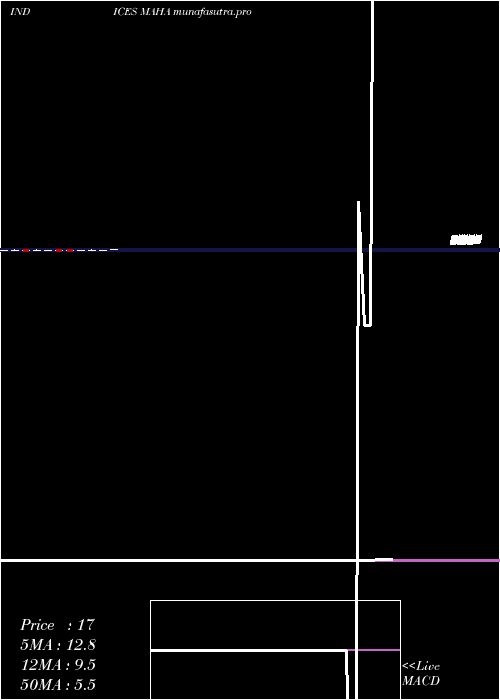
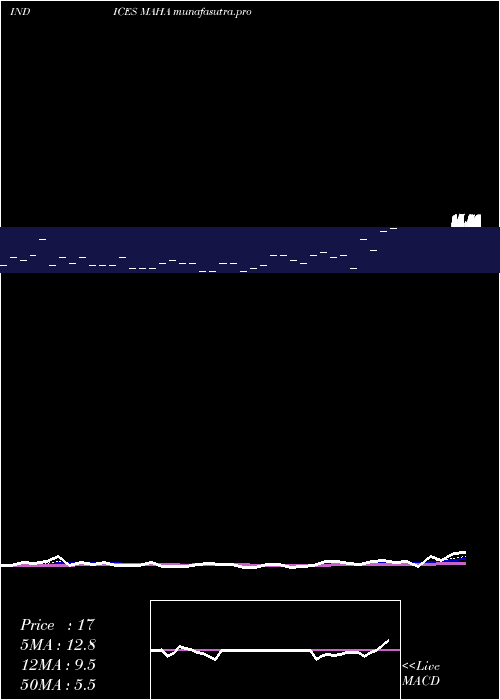
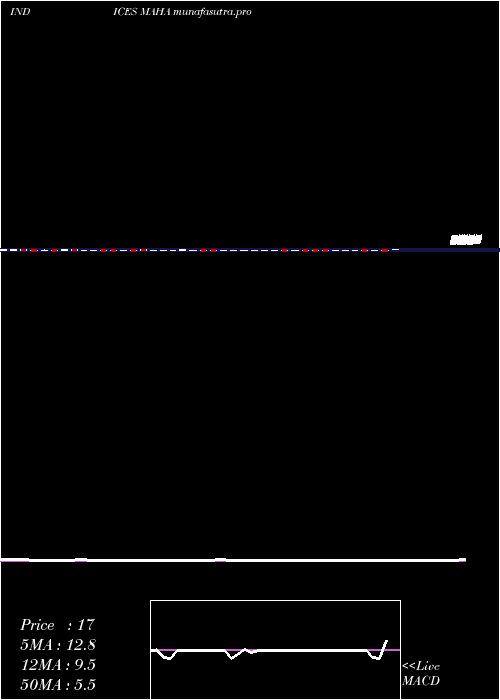
DMA SMA EMA moving averages of 12 Month MAHA
DMA (daily moving average) of 12 Month MAHA
| DMA period | DMA value | | 5 day DMA | 3.8 | | 12 day DMA | 12.58 | | 20 day DMA | 15.45 | | 35 day DMA | 16.34 | | 50 day DMA | 16.02 | | 100 day DMA | 11.59 | | 150 day DMA | 9.05 | | 200 day DMA | 7.63 | EMA (exponential moving average) of 12 Month MAHA
| EMA period | EMA current | EMA prev | EMA prev2 | | 5 day EMA | 4.65 | 6.47 | 8.71 | | 12 day EMA | 10.36 | 12.06 | 13.89 | | 20 day EMA | 12.91 | 14.16 | 15.44 | | 35 day EMA | 14.16 | 14.94 | 15.7 | | 50 day EMA | 14.02 | 14.55 | 15.06 |
SMA (simple moving average) of 12 Month MAHA
| SMA period | SMA current | SMA prev | SMA prev2 | | 5 day SMA | 3.8 | 7.6 | 12.6 | | 12 day SMA | 12.58 | 14.58 | 16.75 | | 20 day SMA | 15.45 | 16.45 | 16.8 | | 35 day SMA | 16.34 | 16.66 | 16.86 | | 50 day SMA | 16.02 | 16.2 | 16.32 | | 100 day SMA | 11.59 | 11.71 | 11.71 | | 150 day SMA | 9.05 | 9.06 | 9.08 | | 200 day SMA | 7.63 | 7.64 | 7.69 |
|
|
