1Month M1LX full analysis,charts,indicators,moving averages,SMA,DMA,EMA,ADX,MACD,RSI1 Month M1LX WideScreen charts, DMA,SMA,EMA technical analysis, forecast prediction, by indicators ADX,MACD,RSI,CCI INDICES stock exchange
Daily price and charts and targets 1Month Strong Daily Stock price targets for 1Month M1LX are 213 and 213 | Daily Target 1 | 213 | | Daily Target 2 | 213 | | Daily Target 3 | 213 | | Daily Target 4 | 213 | | Daily Target 5 | 213 |
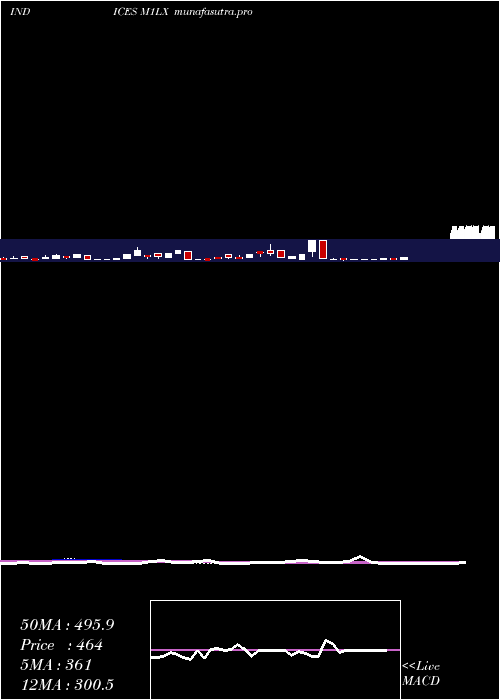
Daily price and volume 1 Month
| Date |
Closing |
Open |
Range |
Volume |
Thu 04 December 2025 |
213.00 (-25%) |
213.00 |
213.00 - 213.00 |
0.9942 times |
Wed 03 December 2025 |
284.00 (-6.89%) |
284.00 |
284.00 - 284.00 |
0.9942 times |
Tue 02 December 2025 |
305.00 (34.96%) |
305.00 |
305.00 - 305.00 |
0.9952 times |
Mon 01 December 2025 |
226.00 (126%) |
226.00 |
226.00 - 226.00 |
0.9988 times |
Fri 28 November 2025 |
100.00 (-23.66%) |
100.00 |
100.00 - 100.00 |
0.9908 times |
Wed 26 November 2025 |
131.00 (-49.62%) |
131.00 |
131.00 - 131.00 |
0.999 times |
Tue 25 November 2025 |
260.00 (-36.89%) |
260.00 |
260.00 - 260.00 |
0.9952 times |
Mon 24 November 2025 |
412.00 (-67.3%) |
412.00 |
412.00 - 412.00 |
1.0412 times |
Fri 21 November 2025 |
1260.00 (-12.56%) |
1260.00 |
1260.00 - 1260.00 |
0.9956 times |
Thu 20 November 2025 |
1441.00 (35.94%) |
1441.00 |
1441.00 - 1441.00 |
0.9958 times |
Wed 19 November 2025 |
1060.00 (-32.4%) |
1060.00 |
1060.00 - 1060.00 |
0.994 times |
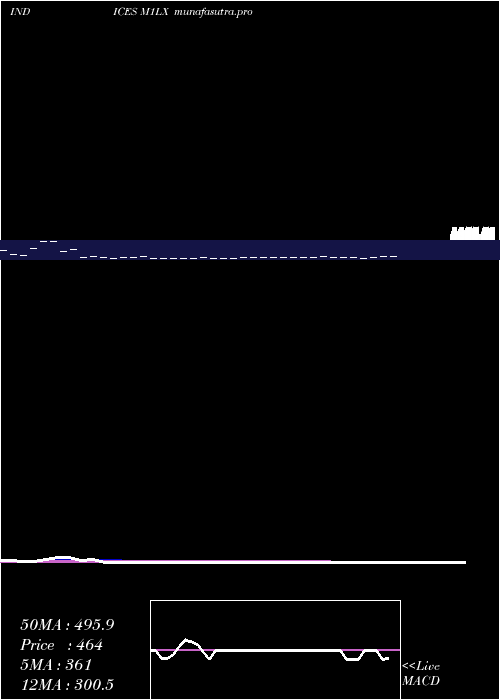
Weekly price and charts 1Month Strong weekly Stock price targets for 1Month M1LX are 167 and 259 | Weekly Target 1 | 151.67 | | Weekly Target 2 | 182.33 | | Weekly Target 3 | 243.66666666667 | | Weekly Target 4 | 274.33 | | Weekly Target 5 | 335.67 |
Weekly price and volumes for 1 Month
| Date |
Closing |
Open |
Range |
Volume |
Thu 04 December 2025 |
213.00 (113%) |
226.00 |
213.00 - 305.00 |
1.5247 times |
Fri 28 November 2025 |
100.00 (-92.06%) |
412.00 |
100.00 - 412.00 |
1.5415 times |
Fri 21 November 2025 |
1260.00 (-5.12%) |
1447.00 |
1060.00 - 1568.00 |
1.9069 times |
Fri 14 November 2025 |
1328.00 (62.15%) |
475.00 |
398.00 - 1328.00 |
1.9049 times |
Fri 07 November 2025 |
819.00 (-47.97%) |
819.00 |
819.00 - 819.00 |
0.3013 times |
Fri 07 November 2025 |
1574.00 (19.6%) |
365.00 |
365.00 - 1574.00 |
0.6815 times |
Thu 06 November 2025 |
1316.00 (29.78%) |
421.00 |
421.00 - 1316.00 |
0.6857 times |
Wed 05 November 2025 |
1014.00 (-29.73%) |
709.00 |
709.00 - 1014.00 |
0.69 times |
Tue 04 November 2025 |
1443.00 (44.3%) |
1443.00 |
1443.00 - 1443.00 |
0.3817 times |
Fri 31 October 2025 |
1000.00 (0%) |
1000.00 |
1000.00 - 1000.00 |
0.3818 times |
Fri 31 October 2025 |
1000.00 (0%) |
1000.00 |
1000.00 - 1000.00 |
0.3818 times |
Monthly price and charts 1Month Strong monthly Stock price targets for 1Month M1LX are 167 and 259 | Monthly Target 1 | 151.67 | | Monthly Target 2 | 182.33 | | Monthly Target 3 | 243.66666666667 | | Monthly Target 4 | 274.33 | | Monthly Target 5 | 335.67 |
Monthly price and volumes 1 Month
| Date |
Closing |
Open |
Range |
Volume |
Thu 04 December 2025 |
213.00 (113%) |
226.00 |
213.00 - 305.00 |
0.1941 times |
Fri 28 November 2025 |
100.00 (-90%) |
1443.00 |
100.00 - 1574.00 |
1.0301 times |
Fri 31 October 2025 |
1000.00 (14.16%) |
766.00 |
55.00 - 1825.00 |
1.7649 times |
Tue 30 September 2025 |
876.00 (298.18%) |
515.00 |
207.00 - 1016.00 |
1.0218 times |
Fri 29 August 2025 |
220.00 (-82.46%) |
2014.00 |
122.00 - 2014.00 |
1.0183 times |
Thu 31 July 2025 |
1254.00 (233.51%) |
313.00 |
97.00 - 1254.00 |
1.0662 times |
Mon 30 June 2025 |
376.00 (-2.08%) |
565.00 |
163.00 - 966.00 |
0.9182 times |
Fri 30 May 2025 |
384.00 (123.26%) |
127.00 |
98.00 - 474.00 |
1.1056 times |
Wed 30 April 2025 |
172.00 (-89.76%) |
980.00 |
82.00 - 3641.00 |
0.961 times |
Mon 31 March 2025 |
1679.00 (19.25%) |
1801.00 |
253.00 - 2769.00 |
0.9198 times |
Fri 28 February 2025 |
1408.00 (243.41%) |
1042.00 |
302.00 - 1515.00 |
0.9201 times |

DMA SMA EMA moving averages of 1 Month M1LX
DMA (daily moving average) of 1 Month M1LX
| DMA period | DMA value | | 5 day DMA | 225.6 | | 12 day DMA | 605 | | 20 day DMA | 735 | | 35 day DMA | 809.06 | | 50 day DMA | 661 | | 100 day DMA | 579.59 | | 150 day DMA | 542.84 | | 200 day DMA | 547.09 | EMA (exponential moving average) of 1 Month M1LX
| EMA period | EMA current | EMA prev | EMA prev2 | | 5 day EMA | 279.09 | 312.13 | 326.19 | | 12 day EMA | 471.5 | 518.48 | 561.1 | | 20 day EMA | 590.13 | 629.81 | 666.2 | | 35 day EMA | 621.15 | 645.18 | 666.44 | | 50 day EMA | 599.65 | 615.43 | 628.95 |
SMA (simple moving average) of 1 Month M1LX
| SMA period | SMA current | SMA prev | SMA prev2 | | 5 day SMA | 225.6 | 209.2 | 204.4 | | 12 day SMA | 605 | 707.83 | 794.83 | | 20 day SMA | 735 | 742.6 | 794.2 | | 35 day SMA | 809.06 | 818.11 | 812.31 | | 50 day SMA | 661 | 659.28 | 672.34 | | 100 day SMA | 579.59 | 585.48 | 589.6 | | 150 day SMA | 542.84 | 542.89 | 544.09 | | 200 day SMA | 547.09 | 552.73 | 555.92 |
|
|
