1Month M1LN full analysis,charts,indicators,moving averages,SMA,DMA,EMA,ADX,MACD,RSI1 Month M1LN WideScreen charts, DMA,SMA,EMA technical analysis, forecast prediction, by indicators ADX,MACD,RSI,CCI INDICES stock exchange
Daily price and charts and targets 1Month Strong Daily Stock price targets for 1Month M1LN are 82 and 82 | Daily Target 1 | 82 | | Daily Target 2 | 82 | | Daily Target 3 | 82 | | Daily Target 4 | 82 | | Daily Target 5 | 82 |
Daily price and volume 1 Month
| Date |
Closing |
Open |
Range |
Volume |
Thu 04 December 2025 |
82.00 (5.13%) |
82.00 |
82.00 - 82.00 |
0.991 times |
Wed 03 December 2025 |
78.00 (36.84%) |
78.00 |
78.00 - 78.00 |
0.991 times |
Tue 02 December 2025 |
57.00 (21.28%) |
57.00 |
57.00 - 57.00 |
0.991 times |
Mon 01 December 2025 |
47.00 (213.33%) |
47.00 |
47.00 - 47.00 |
0.9931 times |
Fri 28 November 2025 |
15.00 (-21.05%) |
15.00 |
15.00 - 15.00 |
0.9895 times |
Wed 26 November 2025 |
19.00 (-66.07%) |
19.00 |
19.00 - 19.00 |
0.9937 times |
Tue 25 November 2025 |
56.00 (-54.1%) |
56.00 |
56.00 - 56.00 |
0.9942 times |
Mon 24 November 2025 |
122.00 (-58.5%) |
122.00 |
122.00 - 122.00 |
1.0728 times |
Fri 21 November 2025 |
294.00 (-30.99%) |
294.00 |
294.00 - 294.00 |
0.9921 times |
Thu 20 November 2025 |
426.00 (38.31%) |
426.00 |
426.00 - 426.00 |
0.9916 times |
Wed 19 November 2025 |
308.00 (-42%) |
308.00 |
308.00 - 308.00 |
0.9905 times |
Weekly price and charts 1Month Strong weekly Stock price targets for 1Month M1LN are 64.5 and 99.5 | Weekly Target 1 | 35.33 | | Weekly Target 2 | 58.67 | | Weekly Target 3 | 70.333333333333 | | Weekly Target 4 | 93.67 | | Weekly Target 5 | 105.33 |
Weekly price and volumes for 1 Month
| Date |
Closing |
Open |
Range |
Volume |
Thu 04 December 2025 |
82.00 (446.67%) |
47.00 |
47.00 - 82.00 |
1.4992 times |
Fri 28 November 2025 |
15.00 (-94.9%) |
122.00 |
15.00 - 122.00 |
1.5309 times |
Fri 21 November 2025 |
294.00 (-19.89%) |
454.00 |
294.00 - 531.00 |
1.8751 times |
Fri 14 November 2025 |
367.00 (49.8%) |
152.00 |
93.00 - 367.00 |
1.8722 times |
Fri 07 November 2025 |
245.00 (-33.78%) |
245.00 |
245.00 - 245.00 |
0.3488 times |
Fri 07 November 2025 |
370.00 (0.82%) |
132.00 |
132.00 - 370.00 |
0.7212 times |
Thu 06 November 2025 |
367.00 (39.02%) |
125.00 |
125.00 - 367.00 |
0.7198 times |
Wed 05 November 2025 |
264.00 (-32.65%) |
212.00 |
212.00 - 264.00 |
0.7042 times |
Tue 04 November 2025 |
392.00 (46.82%) |
392.00 |
392.00 - 392.00 |
0.3752 times |
Fri 31 October 2025 |
267.00 (-32.41%) |
267.00 |
267.00 - 267.00 |
0.3534 times |
Fri 31 October 2025 |
395.00 (47.94%) |
395.00 |
395.00 - 395.00 |
0.3752 times |
Monthly price and charts 1Month Strong monthly Stock price targets for 1Month M1LN are 64.5 and 99.5 | Monthly Target 1 | 35.33 | | Monthly Target 2 | 58.67 | | Monthly Target 3 | 70.333333333333 | | Monthly Target 4 | 93.67 | | Monthly Target 5 | 105.33 |
Monthly price and volumes 1 Month
| Date |
Closing |
Open |
Range |
Volume |
Thu 04 December 2025 |
82.00 (446.67%) |
47.00 |
47.00 - 82.00 |
0.1917 times |
Fri 28 November 2025 |
15.00 (-94.38%) |
392.00 |
15.00 - 531.00 |
1.042 times |
Fri 31 October 2025 |
267.00 (-18.84%) |
273.00 |
16.00 - 846.00 |
1.7866 times |
Tue 30 September 2025 |
329.00 (722.5%) |
169.00 |
69.00 - 486.00 |
1.0115 times |
Fri 29 August 2025 |
40.00 (-91.38%) |
746.00 |
16.00 - 746.00 |
1.0118 times |
Thu 31 July 2025 |
464.00 (268.25%) |
78.00 |
20.00 - 464.00 |
1.0576 times |
Mon 30 June 2025 |
126.00 (35.48%) |
192.00 |
36.00 - 321.00 |
0.9122 times |
Fri 30 May 2025 |
93.00 (190.63%) |
24.00 |
21.00 - 175.00 |
1.1037 times |
Wed 30 April 2025 |
32.00 (-93.6%) |
185.00 |
17.00 - 1482.00 |
0.9644 times |
Mon 31 March 2025 |
500.00 (15.47%) |
592.00 |
50.00 - 988.00 |
0.9184 times |
Fri 28 February 2025 |
433.00 (283.19%) |
319.00 |
85.00 - 496.00 |
0.9195 times |

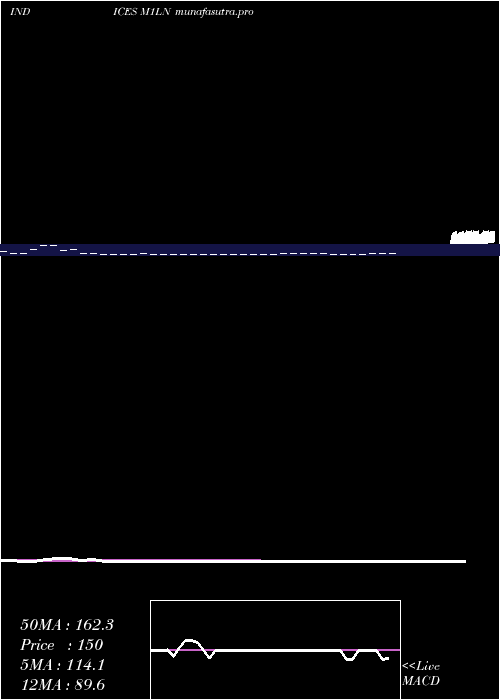
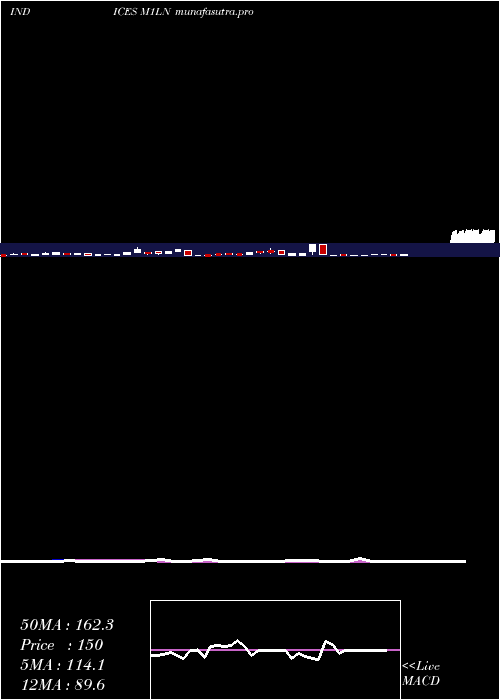
DMA SMA EMA moving averages of 1 Month M1LN
DMA (daily moving average) of 1 Month M1LN
| DMA period | DMA value | | 5 day DMA | 55.8 | | 12 day DMA | 169.58 | | 20 day DMA | 201.9 | | 35 day DMA | 244.11 | | 50 day DMA | 198.34 | | 100 day DMA | 194.86 | | 150 day DMA | 182.53 | | 200 day DMA | 182.6 | EMA (exponential moving average) of 1 Month M1LN
| EMA period | EMA current | EMA prev | EMA prev2 | | 5 day EMA | 77.35 | 75.02 | 73.53 | | 12 day EMA | 129.2 | 137.78 | 148.64 | | 20 day EMA | 165.83 | 174.65 | 184.82 | | 35 day EMA | 180.37 | 186.16 | 192.53 | | 50 day EMA | 182.03 | 186.11 | 190.52 |
SMA (simple moving average) of 1 Month M1LN
| SMA period | SMA current | SMA prev | SMA prev2 | | 5 day SMA | 55.8 | 43.2 | 38.8 | | 12 day SMA | 169.58 | 200.58 | 224.67 | | 20 day SMA | 201.9 | 204.4 | 218.85 | | 35 day SMA | 244.11 | 247.09 | 245.77 | | 50 day SMA | 198.34 | 197.9 | 202.9 | | 100 day SMA | 194.86 | 196.63 | 197.98 | | 150 day SMA | 182.53 | 182.19 | 182.67 | | 200 day SMA | 182.6 | 184.92 | 186.33 |
|
|
