1Month M1HQ full analysis,charts,indicators,moving averages,SMA,DMA,EMA,ADX,MACD,RSI1 Month M1HQ WideScreen charts, DMA,SMA,EMA technical analysis, forecast prediction, by indicators ADX,MACD,RSI,CCI INDICES stock exchange
Daily price and charts and targets 1Month Strong Daily Stock price targets for 1Month M1HQ are 570 and 570 | Daily Target 1 | 570 | | Daily Target 2 | 570 | | Daily Target 3 | 570 | | Daily Target 4 | 570 | | Daily Target 5 | 570 |
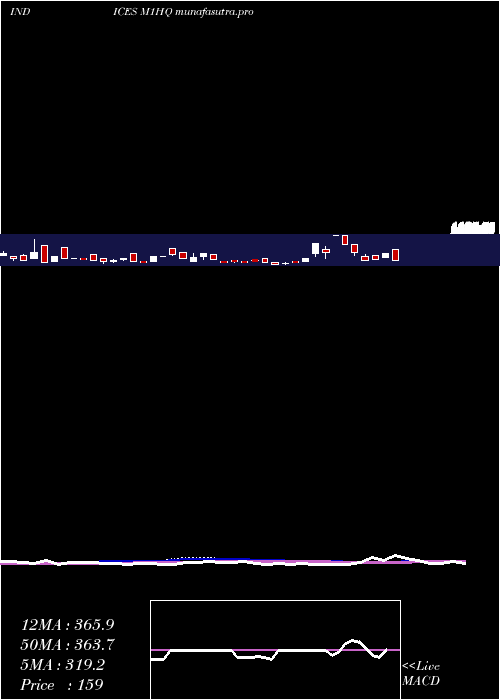
Daily price and volume 1 Month
| Date |
Closing |
Open |
Range |
Volume |
Thu 04 December 2025 |
570.00 (16.33%) |
570.00 |
570.00 - 570.00 |
0.9965 times |
Wed 03 December 2025 |
490.00 (74.38%) |
490.00 |
490.00 - 490.00 |
0.9972 times |
Tue 02 December 2025 |
281.00 (-9.06%) |
281.00 |
281.00 - 281.00 |
0.9981 times |
Mon 01 December 2025 |
309.00 (14.44%) |
309.00 |
309.00 - 309.00 |
1.003 times |
Fri 28 November 2025 |
270.00 (-28.57%) |
270.00 |
270.00 - 270.00 |
0.9933 times |
Wed 26 November 2025 |
378.00 (-18.18%) |
378.00 |
378.00 - 378.00 |
1.0039 times |
Tue 25 November 2025 |
462.00 (58.22%) |
462.00 |
462.00 - 462.00 |
0.9969 times |
Mon 24 November 2025 |
292.00 (56.99%) |
292.00 |
292.00 - 292.00 |
1.0113 times |
Fri 21 November 2025 |
186.00 (1.64%) |
186.00 |
186.00 - 186.00 |
0.9997 times |
Thu 20 November 2025 |
183.00 (50%) |
183.00 |
183.00 - 183.00 |
1.0001 times |
Wed 19 November 2025 |
122.00 (-3.94%) |
122.00 |
122.00 - 122.00 |
0.9978 times |

Weekly price and charts 1Month Strong weekly Stock price targets for 1Month M1HQ are 425.5 and 714.5 | Weekly Target 1 | 184.67 | | Weekly Target 2 | 377.33 | | Weekly Target 3 | 473.66666666667 | | Weekly Target 4 | 666.33 | | Weekly Target 5 | 762.67 |
Weekly price and volumes for 1 Month
| Date |
Closing |
Open |
Range |
Volume |
Thu 04 December 2025 |
570.00 (111.11%) |
309.00 |
281.00 - 570.00 |
1.5423 times |
Fri 28 November 2025 |
270.00 (45.16%) |
292.00 |
270.00 - 462.00 |
1.5464 times |
Fri 21 November 2025 |
186.00 (36.76%) |
164.00 |
122.00 - 186.00 |
1.9307 times |
Fri 14 November 2025 |
136.00 (209.09%) |
297.00 |
136.00 - 331.00 |
1.9272 times |
Fri 07 November 2025 |
44.00 (-70.27%) |
44.00 |
44.00 - 44.00 |
0.274 times |
Fri 07 November 2025 |
148.00 (-18.23%) |
91.00 |
91.00 - 148.00 |
0.6579 times |
Thu 06 November 2025 |
181.00 (-5.24%) |
52.00 |
52.00 - 181.00 |
0.6666 times |
Wed 05 November 2025 |
191.00 (61.86%) |
35.00 |
35.00 - 191.00 |
0.6832 times |
Tue 04 November 2025 |
118.00 (-23.87%) |
118.00 |
118.00 - 118.00 |
0.3857 times |
Fri 31 October 2025 |
155.00 (0%) |
155.00 |
155.00 - 155.00 |
0.386 times |
Fri 31 October 2025 |
155.00 (0%) |
155.00 |
155.00 - 155.00 |
0.386 times |
Monthly price and charts 1Month Strong monthly Stock price targets for 1Month M1HQ are 425.5 and 714.5 | Monthly Target 1 | 184.67 | | Monthly Target 2 | 377.33 | | Monthly Target 3 | 473.66666666667 | | Monthly Target 4 | 666.33 | | Monthly Target 5 | 762.67 |
Monthly price and volumes 1 Month
| Date |
Closing |
Open |
Range |
Volume |
Thu 04 December 2025 |
570.00 (111.11%) |
309.00 |
281.00 - 570.00 |
0.1953 times |
Fri 28 November 2025 |
270.00 (74.19%) |
118.00 |
35.00 - 462.00 |
1.0221 times |
Fri 31 October 2025 |
155.00 (-46.55%) |
352.00 |
32.00 - 535.00 |
1.7475 times |
Tue 30 September 2025 |
290.00 (-10.49%) |
308.00 |
180.00 - 578.00 |
1.0283 times |
Fri 29 August 2025 |
324.00 (83.05%) |
100.00 |
100.00 - 609.00 |
1.0237 times |
Thu 31 July 2025 |
177.00 (-61.61%) |
702.00 |
177.00 - 781.00 |
1.0721 times |
Mon 30 June 2025 |
461.00 (125.98%) |
297.00 |
159.00 - 597.00 |
0.9219 times |
Fri 30 May 2025 |
204.00 (-38.74%) |
492.00 |
160.00 - 1124.00 |
1.1075 times |
Wed 30 April 2025 |
333.00 (258.06%) |
91.00 |
41.00 - 447.00 |
0.9599 times |
Mon 31 March 2025 |
93.00 (-14.68%) |
177.00 |
84.00 - 256.00 |
0.9218 times |
Fri 28 February 2025 |
109.00 (-59.33%) |
131.00 |
109.00 - 434.00 |
0.9225 times |
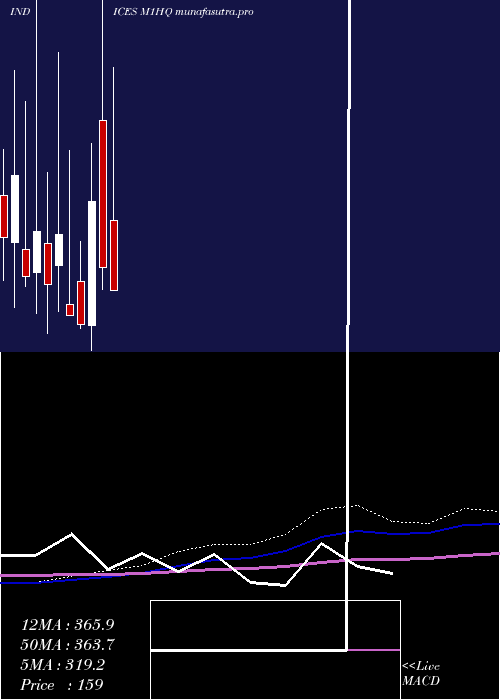
DMA SMA EMA moving averages of 1 Month M1HQ
DMA (daily moving average) of 1 Month M1HQ
| DMA period | DMA value | | 5 day DMA | 384 | | 12 day DMA | 305.83 | | 20 day DMA | 262.85 | | 35 day DMA | 214.69 | | 50 day DMA | 201.88 | | 100 day DMA | 282.58 | | 150 day DMA | 316.01 | | 200 day DMA | 313.83 | EMA (exponential moving average) of 1 Month M1HQ
| EMA period | EMA current | EMA prev | EMA prev2 | | 5 day EMA | 431.24 | 361.87 | 297.81 | | 12 day EMA | 342.61 | 301.28 | 266.98 | | 20 day EMA | 293.65 | 264.57 | 240.85 | | 35 day EMA | 256.11 | 237.63 | 222.77 | | 50 day EMA | 227 | 213.01 | 201.71 |
SMA (simple moving average) of 1 Month M1HQ
| SMA period | SMA current | SMA prev | SMA prev2 | | 5 day SMA | 384 | 345.6 | 340 | | 12 day SMA | 305.83 | 272 | 242.5 | | 20 day SMA | 262.85 | 238.9 | 223.45 | | 35 day SMA | 214.69 | 205.23 | 196.97 | | 50 day SMA | 201.88 | 194.26 | 191.1 | | 100 day SMA | 282.58 | 279.36 | 276.88 | | 150 day SMA | 316.01 | 314.69 | 312.49 | | 200 day SMA | 313.83 | 311.44 | 309.46 |
|
|
