1Month M1HE full analysis,charts,indicators,moving averages,SMA,DMA,EMA,ADX,MACD,RSI1 Month M1HE WideScreen charts, DMA,SMA,EMA technical analysis, forecast prediction, by indicators ADX,MACD,RSI,CCI INDICES stock exchange
Daily price and charts and targets 1Month Strong Daily Stock price targets for 1Month M1HE are 869 and 869 | Daily Target 1 | 869 | | Daily Target 2 | 869 | | Daily Target 3 | 869 | | Daily Target 4 | 869 | | Daily Target 5 | 869 |
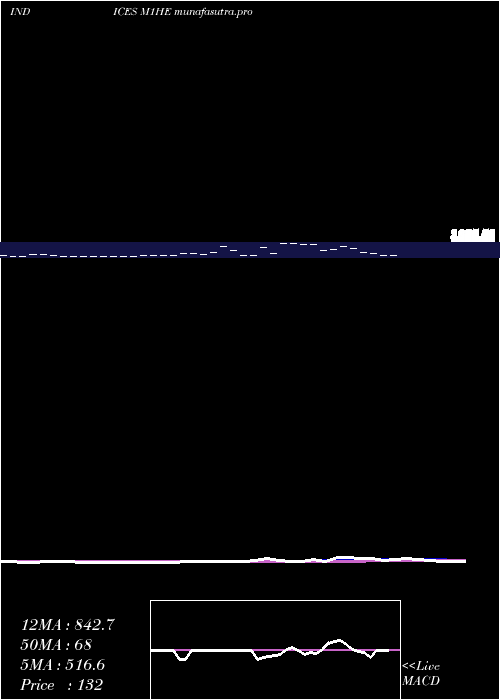
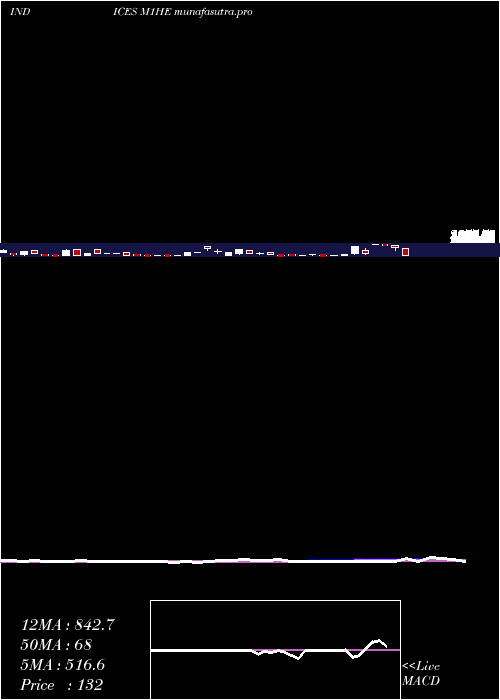
Daily price and volume 1 Month
| Date |
Closing |
Open |
Range |
Volume |
Thu 04 December 2025 |
869.00 (9.45%) |
869.00 |
869.00 - 869.00 |
0.9963 times |
Wed 03 December 2025 |
794.00 (170.99%) |
794.00 |
794.00 - 794.00 |
1.0064 times |
Tue 02 December 2025 |
293.00 (-45.64%) |
293.00 |
293.00 - 293.00 |
1.0119 times |
Mon 01 December 2025 |
539.00 (-15.52%) |
539.00 |
539.00 - 539.00 |
1.0186 times |
Fri 28 November 2025 |
638.00 (17.5%) |
638.00 |
638.00 - 638.00 |
0.9011 times |
Wed 26 November 2025 |
543.00 (99.63%) |
543.00 |
543.00 - 543.00 |
1.0085 times |
Tue 25 November 2025 |
272.00 (172%) |
272.00 |
272.00 - 272.00 |
1.0138 times |
Mon 24 November 2025 |
100.00 (-30.07%) |
100.00 |
100.00 - 100.00 |
1.0101 times |
Fri 21 November 2025 |
143.00 (-21.43%) |
143.00 |
143.00 - 143.00 |
1.0138 times |
Thu 20 November 2025 |
182.00 (104.49%) |
182.00 |
182.00 - 182.00 |
1.0196 times |
Wed 19 November 2025 |
89.00 (-26.45%) |
89.00 |
89.00 - 89.00 |
0.9992 times |
Weekly price and charts 1Month Strong weekly Stock price targets for 1Month M1HE are 581 and 1157 | Weekly Target 1 | 101 | | Weekly Target 2 | 485 | | Weekly Target 3 | 677 | | Weekly Target 4 | 1061 | | Weekly Target 5 | 1253 |
Weekly price and volumes for 1 Month
| Date |
Closing |
Open |
Range |
Volume |
Thu 04 December 2025 |
869.00 (36.21%) |
539.00 |
293.00 - 869.00 |
1.6176 times |
Fri 28 November 2025 |
638.00 (346.15%) |
100.00 |
100.00 - 638.00 |
1.5776 times |
Fri 21 November 2025 |
143.00 (9.16%) |
117.00 |
89.00 - 182.00 |
2.0262 times |
Fri 14 November 2025 |
131.00 (627.78%) |
318.00 |
131.00 - 603.00 |
2.0023 times |
Fri 07 November 2025 |
18.00 (-77.22%) |
18.00 |
18.00 - 18.00 |
0.176 times |
Fri 07 November 2025 |
79.00 (-14.13%) |
24.00 |
24.00 - 79.00 |
0.5954 times |
Thu 06 November 2025 |
92.00 (-1.08%) |
15.00 |
15.00 - 92.00 |
0.602 times |
Wed 05 November 2025 |
93.00 (50%) |
20.00 |
20.00 - 93.00 |
0.5946 times |
Tue 04 November 2025 |
62.00 (-65.93%) |
62.00 |
62.00 - 62.00 |
0.4061 times |
Fri 31 October 2025 |
182.00 (0%) |
182.00 |
182.00 - 182.00 |
0.4023 times |
Fri 31 October 2025 |
182.00 (0%) |
182.00 |
182.00 - 182.00 |
0.4022 times |
Monthly price and charts 1Month Strong monthly Stock price targets for 1Month M1HE are 581 and 1157 | Monthly Target 1 | 101 | | Monthly Target 2 | 485 | | Monthly Target 3 | 677 | | Monthly Target 4 | 1061 | | Monthly Target 5 | 1253 |
Monthly price and volumes 1 Month
| Date |
Closing |
Open |
Range |
Volume |
Thu 04 December 2025 |
869.00 (36.21%) |
539.00 |
293.00 - 869.00 |
0.2153 times |
Fri 28 November 2025 |
638.00 (250.55%) |
62.00 |
15.00 - 638.00 |
1.0621 times |
Fri 31 October 2025 |
182.00 (-62.55%) |
1069.00 |
35.00 - 1754.00 |
1.7375 times |
Tue 30 September 2025 |
486.00 (-15.77%) |
241.00 |
112.00 - 2077.00 |
1.0707 times |
Fri 29 August 2025 |
577.00 (-13.62%) |
328.00 |
118.00 - 1901.00 |
1.0391 times |
Thu 31 July 2025 |
668.00 (-60.02%) |
1202.00 |
227.00 - 1577.00 |
1.0725 times |
Mon 30 June 2025 |
1671.00 (593.36%) |
528.00 |
234.00 - 1731.00 |
0.8984 times |
Fri 30 May 2025 |
241.00 (-31.73%) |
700.00 |
132.00 - 2159.00 |
1.0756 times |
Wed 30 April 2025 |
353.00 (72.2%) |
86.00 |
37.00 - 556.00 |
0.9509 times |
Mon 31 March 2025 |
205.00 (-57.64%) |
565.00 |
48.00 - 565.00 |
0.8779 times |
Fri 28 February 2025 |
484.00 (-43.79%) |
183.00 |
183.00 - 1173.00 |
0.8611 times |

DMA SMA EMA moving averages of 1 Month M1HE
DMA (daily moving average) of 1 Month M1HE
| DMA period | DMA value | | 5 day DMA | 626.6 | | 12 day DMA | 381.92 | | 20 day DMA | 329.5 | | 35 day DMA | 319.11 | | 50 day DMA | 390.14 | | 100 day DMA | 581.22 | | 150 day DMA | 650.91 | | 200 day DMA | 621.56 | EMA (exponential moving average) of 1 Month M1HE
| EMA period | EMA current | EMA prev | EMA prev2 | | 5 day EMA | 644.57 | 532.37 | 401.58 | | 12 day EMA | 475.18 | 403.6 | 332.64 | | 20 day EMA | 399.83 | 350.47 | 303.8 | | 35 day EMA | 390.69 | 362.53 | 337.13 | | 50 day EMA | 407.75 | 388.93 | 372.4 |
SMA (simple moving average) of 1 Month M1HE
| SMA period | SMA current | SMA prev | SMA prev2 | | 5 day SMA | 626.6 | 561.4 | 457 | | 12 day SMA | 381.92 | 319.25 | 264 | | 20 day SMA | 329.5 | 287.25 | 252.15 | | 35 day SMA | 319.11 | 331 | 326.06 | | 50 day SMA | 390.14 | 375.26 | 369.52 | | 100 day SMA | 581.22 | 577.79 | 574.64 | | 150 day SMA | 650.91 | 649.07 | 644.66 | | 200 day SMA | 621.56 | 617.7 | 613.97 |
|
|
