1Month M1HA full analysis,charts,indicators,moving averages,SMA,DMA,EMA,ADX,MACD,RSI1 Month M1HA WideScreen charts, DMA,SMA,EMA technical analysis, forecast prediction, by indicators ADX,MACD,RSI,CCI INDICES stock exchange
Daily price and charts and targets 1Month Strong Daily Stock price targets for 1Month M1HA are 30 and 30 | Daily Target 1 | 30 | | Daily Target 2 | 30 | | Daily Target 3 | 30 | | Daily Target 4 | 30 | | Daily Target 5 | 30 |
Daily price and volume 1 Month
| Date |
Closing |
Open |
Range |
Volume |
Thu 04 December 2025 |
30.00 (0%) |
30.00 |
30.00 - 30.00 |
0.9935 times |
Wed 03 December 2025 |
30.00 (100%) |
30.00 |
30.00 - 30.00 |
0.9843 times |
Tue 02 December 2025 |
15.00 (-60.53%) |
15.00 |
15.00 - 15.00 |
0.9935 times |
Mon 01 December 2025 |
38.00 (2.7%) |
38.00 |
38.00 - 38.00 |
0.9935 times |
Fri 28 November 2025 |
37.00 (54.17%) |
37.00 |
37.00 - 37.00 |
0.9612 times |
Wed 26 November 2025 |
24.00 (84.62%) |
24.00 |
24.00 - 24.00 |
0.9704 times |
Tue 25 November 2025 |
13.00 (62.5%) |
13.00 |
13.00 - 13.00 |
0.975 times |
Mon 24 November 2025 |
8.00 (33.33%) |
8.00 |
8.00 - 8.00 |
1.1922 times |
Fri 21 November 2025 |
6.00 (-50%) |
6.00 |
6.00 - 6.00 |
0.9658 times |
Thu 20 November 2025 |
12.00 (33.33%) |
12.00 |
12.00 - 12.00 |
0.9704 times |
Wed 19 November 2025 |
9.00 (28.57%) |
9.00 |
9.00 - 9.00 |
0.9704 times |
Weekly price and charts 1Month Strong weekly Stock price targets for 1Month M1HA are 11 and 34 | Weekly Target 1 | 4.67 | | Weekly Target 2 | 17.33 | | Weekly Target 3 | 27.666666666667 | | Weekly Target 4 | 40.33 | | Weekly Target 5 | 50.67 |
Weekly price and volumes for 1 Month
| Date |
Closing |
Open |
Range |
Volume |
Thu 04 December 2025 |
30.00 (-18.92%) |
38.00 |
15.00 - 38.00 |
1.5374 times |
Fri 28 November 2025 |
37.00 (516.67%) |
8.00 |
8.00 - 37.00 |
1.5893 times |
Fri 21 November 2025 |
6.00 (0%) |
7.00 |
6.00 - 12.00 |
1.885 times |
Fri 14 November 2025 |
6.00 (500%) |
15.00 |
6.00 - 15.00 |
1.9154 times |
Fri 07 November 2025 |
1.00 (-83.33%) |
1.00 |
1.00 - 1.00 |
0.2741 times |
Fri 07 November 2025 |
6.00 (-25%) |
2.00 |
2.00 - 6.00 |
0.6773 times |
Thu 06 November 2025 |
8.00 (-20%) |
2.00 |
2.00 - 8.00 |
0.6665 times |
Wed 05 November 2025 |
10.00 (66.67%) |
0.01 |
0.01 - 10.00 |
0.6737 times |
Tue 04 November 2025 |
6.00 (-33.33%) |
6.00 |
6.00 - 6.00 |
0.3906 times |
Fri 31 October 2025 |
9.00 (0%) |
9.00 |
9.00 - 9.00 |
0.3906 times |
Fri 31 October 2025 |
9.00 (0%) |
9.00 |
9.00 - 9.00 |
0.3906 times |
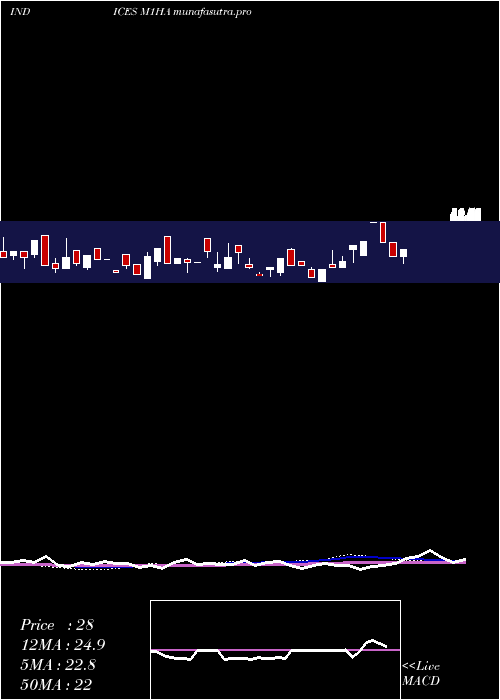
Monthly price and charts 1Month Strong monthly Stock price targets for 1Month M1HA are 11 and 34 | Monthly Target 1 | 4.67 | | Monthly Target 2 | 17.33 | | Monthly Target 3 | 27.666666666667 | | Monthly Target 4 | 40.33 | | Monthly Target 5 | 50.67 |
Monthly price and volumes 1 Month
| Date |
Closing |
Open |
Range |
Volume |
Thu 04 December 2025 |
30.00 (-18.92%) |
38.00 |
15.00 - 38.00 |
0.1988 times |
Fri 28 November 2025 |
37.00 (311.11%) |
6.00 |
0.01 - 37.00 |
1.0438 times |
Fri 31 October 2025 |
9.00 (-57.14%) |
25.00 |
0.01 - 47.00 |
1.7852 times |
Tue 30 September 2025 |
21.00 (-46.15%) |
49.00 |
17.00 - 65.00 |
1.0232 times |
Fri 29 August 2025 |
39.00 (1200%) |
2.00 |
2.00 - 43.00 |
1.003 times |
Thu 31 July 2025 |
3.00 (-81.25%) |
27.00 |
3.00 - 40.00 |
1.0621 times |
Mon 30 June 2025 |
16.00 (23.08%) |
40.00 |
12.00 - 44.00 |
0.9215 times |
Fri 30 May 2025 |
13.00 (-23.53%) |
21.00 |
13.00 - 51.00 |
1.1017 times |
Wed 30 April 2025 |
17.00 (54.55%) |
13.00 |
1.00 - 28.00 |
0.9523 times |
Mon 31 March 2025 |
11.00 (83.33%) |
11.00 |
5.00 - 29.00 |
0.9085 times |
Fri 28 February 2025 |
6.00 (-60%) |
12.00 |
6.00 - 33.00 |
0.896 times |

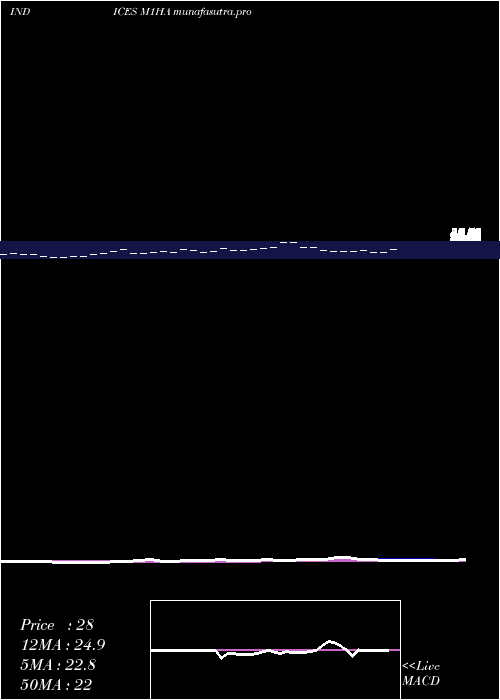
DMA SMA EMA moving averages of 1 Month M1HA
DMA (daily moving average) of 1 Month M1HA
| DMA period | DMA value | | 5 day DMA | 30 | | 12 day DMA | 19.08 | | 20 day DMA | 14.9 | | 35 day DMA | 11.63 | | 50 day DMA | 10.06 | | 100 day DMA | 21.48 | | 150 day DMA | 22.73 | | 200 day DMA | 22.2 | EMA (exponential moving average) of 1 Month M1HA
| EMA period | EMA current | EMA prev | EMA prev2 | | 5 day EMA | 26.99 | 25.49 | 23.23 | | 12 day EMA | 21.51 | 19.97 | 18.15 | | 20 day EMA | 17.82 | 16.54 | 15.12 | | 35 day EMA | 15.02 | 14.14 | 13.21 | | 50 day EMA | 13.4 | 12.72 | 12.02 |
SMA (simple moving average) of 1 Month M1HA
| SMA period | SMA current | SMA prev | SMA prev2 | | 5 day SMA | 30 | 28.8 | 25.4 | | 12 day SMA | 19.08 | 17.17 | 15.17 | | 20 day SMA | 14.9 | 13.5 | 12.4 | | 35 day SMA | 11.63 | 11.09 | 10.31 | | 50 day SMA | 10.06 | 9.82 | 9.76 | | 100 day SMA | 21.48 | 21.36 | 21.25 | | 150 day SMA | 22.73 | 22.77 | 22.75 | | 200 day SMA | 22.2 | 22.15 | 22.06 |
|
|
