SP IDX full analysis,charts,indicators,moving averages,SMA,DMA,EMA,ADX,MACD,RSIS P IDX WideScreen charts, DMA,SMA,EMA technical analysis, forecast prediction, by indicators ADX,MACD,RSI,CCI INDICES stock exchange
Daily price and charts and targets SP Strong Daily Stock price targets for SP IDX are 3317.07 and 3338.71 | Daily Target 1 | 3301.63 | | Daily Target 2 | 3310.87 | | Daily Target 3 | 3323.2666666667 | | Daily Target 4 | 3332.51 | | Daily Target 5 | 3344.91 |
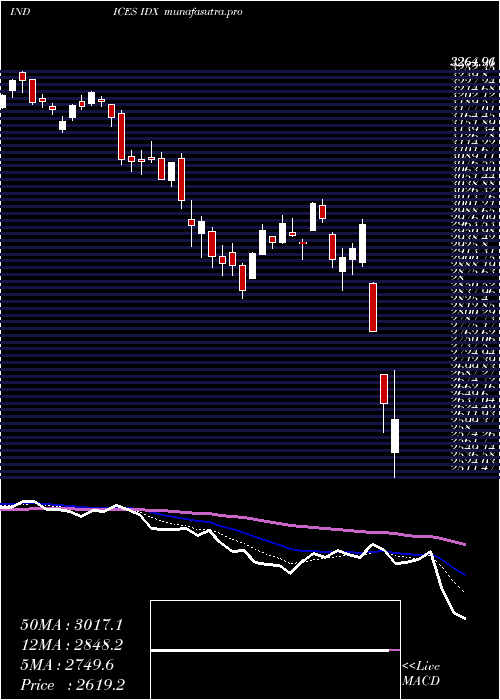
Daily price and volume S P
| Date |
Closing |
Open |
Range |
Volume |
Fri 05 December 2025 |
3320.12 (0.05%) |
3318.75 |
3314.02 - 3335.66 |
1.0234 times |
Thu 04 December 2025 |
3318.38 (0.46%) |
3298.63 |
3298.63 - 3328.59 |
0.9612 times |
Wed 03 December 2025 |
3303.23 (0.73%) |
3279.32 |
3276.85 - 3305.80 |
1.0342 times |
Tue 02 December 2025 |
3279.41 (-0.35%) |
3305.68 |
3279.16 - 3305.95 |
0.9801 times |
Mon 01 December 2025 |
3290.77 (-0.54%) |
3292.86 |
3281.12 - 3315.47 |
1.0268 times |
Fri 28 November 2025 |
3308.49 (0.45%) |
3299.96 |
3296.79 - 3314.90 |
0.4775 times |
Wed 26 November 2025 |
3293.59 (0.61%) |
3271.11 |
3271.11 - 3316.72 |
0.9469 times |
Tue 25 November 2025 |
3273.71 (1.85%) |
3216.30 |
3216.30 - 3278.37 |
1.0608 times |
Mon 24 November 2025 |
3214.40 (0.97%) |
3184.81 |
3181.50 - 3223.87 |
1.2868 times |
Fri 21 November 2025 |
3183.40 (2.36%) |
3120.32 |
3118.52 - 3201.23 |
1.2022 times |
Thu 20 November 2025 |
3109.89 (-1.58%) |
3196.06 |
3107.41 - 3212.93 |
1.1705 times |
Weekly price and charts SP Strong weekly Stock price targets for SP IDX are 3298.49 and 3357.3 | Weekly Target 1 | 3252.07 | | Weekly Target 2 | 3286.09 | | Weekly Target 3 | 3310.8766666667 | | Weekly Target 4 | 3344.9 | | Weekly Target 5 | 3369.69 |
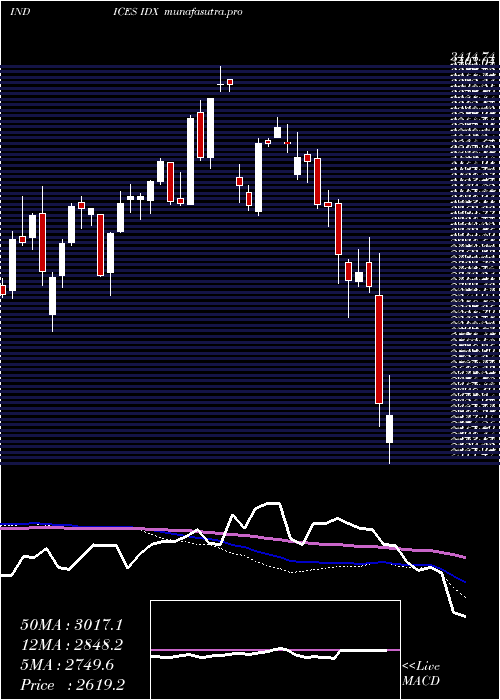
Weekly price and volumes for S P
| Date |
Closing |
Open |
Range |
Volume |
Fri 05 December 2025 |
3320.12 (0.35%) |
3292.86 |
3276.85 - 3335.66 |
1.0313 times |
Fri 28 November 2025 |
3308.49 (3.93%) |
3184.81 |
3181.50 - 3316.72 |
0.7741 times |
Fri 21 November 2025 |
3183.40 (-0.67%) |
3198.75 |
3107.41 - 3212.93 |
1.126 times |
Fri 14 November 2025 |
3205.01 (-1.17%) |
3266.61 |
3176.06 - 3293.18 |
1.0434 times |
Fri 07 November 2025 |
3242.98 (-0.1%) |
3202.99 |
3183.43 - 3257.30 |
1.0702 times |
Fri 31 October 2025 |
3246.26 (0%) |
3229.61 |
3219.88 - 3252.61 |
0.2628 times |
Fri 31 October 2025 |
3246.26 (-1.59%) |
3324.15 |
3219.88 - 3327.22 |
1.2105 times |
Fri 24 October 2025 |
3298.58 (2.32%) |
3245.56 |
3224.39 - 3317.44 |
1.0876 times |
Fri 17 October 2025 |
3223.89 (1.96%) |
3185.85 |
3185.85 - 3288.42 |
1.2271 times |
Fri 10 October 2025 |
3161.88 (-3.86%) |
3307.40 |
3160.74 - 3310.23 |
1.1671 times |
Fri 03 October 2025 |
3288.93 (0.65%) |
3283.12 |
3234.51 - 3307.63 |
0.9339 times |
Monthly price and charts SP Strong monthly Stock price targets for SP IDX are 3298.49 and 3357.3 | Monthly Target 1 | 3252.07 | | Monthly Target 2 | 3286.09 | | Monthly Target 3 | 3310.8766666667 | | Monthly Target 4 | 3344.9 | | Monthly Target 5 | 3369.69 |
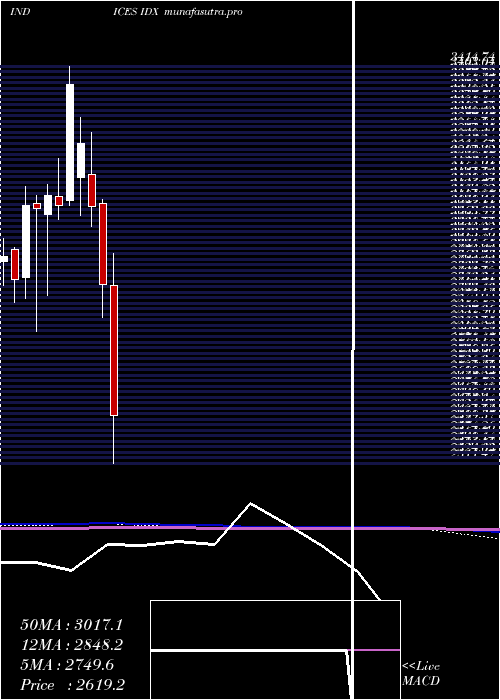
Monthly price and volumes S P
| Date |
Closing |
Open |
Range |
Volume |
Fri 05 December 2025 |
3320.12 (0.35%) |
3292.86 |
3276.85 - 3335.66 |
0.2396 times |
Fri 28 November 2025 |
3308.49 (1.92%) |
3202.99 |
3107.41 - 3316.72 |
0.9324 times |
Fri 31 October 2025 |
3246.26 (-0.53%) |
3256.74 |
3160.74 - 3327.22 |
1.26 times |
Tue 30 September 2025 |
3263.62 (0.29%) |
3219.13 |
3213.60 - 3322.24 |
1.175 times |
Fri 29 August 2025 |
3254.09 (3.26%) |
3116.11 |
3065.31 - 3276.82 |
1.0905 times |
Thu 31 July 2025 |
3151.25 (1.56%) |
3094.95 |
3091.14 - 3225.49 |
1.0474 times |
Mon 30 June 2025 |
3102.87 (3.38%) |
2997.96 |
2955.35 - 3122.40 |
1.0351 times |
Fri 30 May 2025 |
3001.38 (5.25%) |
2862.78 |
2846.75 - 3088.64 |
1.2527 times |
Wed 30 April 2025 |
2851.60 (-2.32%) |
2916.49 |
2511.47 - 2989.56 |
1.0689 times |
Mon 31 March 2025 |
2919.22 (-5.68%) |
3102.01 |
2844.34 - 3111.45 |
0.8983 times |
Fri 28 February 2025 |
3095.15 (-4.44%) |
3169.18 |
3051.43 - 3264.96 |
0.8515 times |
DMA SMA EMA moving averages of S P IDX
DMA (daily moving average) of S P IDX
| DMA period | DMA value | | 5 day DMA | 3302.38 | | 12 day DMA | 3254.59 | | 20 day DMA | 3240.93 | | 35 day DMA | 3246.26 | | 50 day DMA | 3248.29 | | 100 day DMA | 3232.97 | | 150 day DMA | 3170.62 | | 200 day DMA | 3115.02 | EMA (exponential moving average) of S P IDX
| EMA period | EMA current | EMA prev | EMA prev2 | | 5 day EMA | 3303.66 | 3295.43 | 3283.96 | | 12 day EMA | 3274.26 | 3265.92 | 3256.39 | | 20 day EMA | 3259.83 | 3253.49 | 3246.66 | | 35 day EMA | 3253.72 | 3249.81 | 3245.77 | | 50 day EMA | 3256.53 | 3253.94 | 3251.31 |
SMA (simple moving average) of S P IDX
| SMA period | SMA current | SMA prev | SMA prev2 | | 5 day SMA | 3302.38 | 3300.06 | 3295.1 | | 12 day SMA | 3254.59 | 3240.92 | 3226.57 | | 20 day SMA | 3240.93 | 3235.27 | 3231.2 | | 35 day SMA | 3246.26 | 3243.3 | 3241.49 | | 50 day SMA | 3248.29 | 3246.98 | 3246.19 | | 100 day SMA | 3232.97 | 3231.49 | 3230.3 | | 150 day SMA | 3170.62 | 3167.49 | 3164.41 | | 200 day SMA | 3115.02 | 3114.66 | 3114.3 |
|
|
