DjUs DSTY full analysis,charts,indicators,moving averages,SMA,DMA,EMA,ADX,MACD,RSIDj Us DSTY WideScreen charts, DMA,SMA,EMA technical analysis, forecast prediction, by indicators ADX,MACD,RSI,CCI INDICES stock exchange
Daily price and charts and targets DjUs Strong Daily Stock price targets for DjUs DSTY are 2004.92 and 2038.59 | Daily Target 1 | 1978.13 | | Daily Target 2 | 1998.03 | | Daily Target 3 | 2011.8033333333 | | Daily Target 4 | 2031.7 | | Daily Target 5 | 2045.47 |
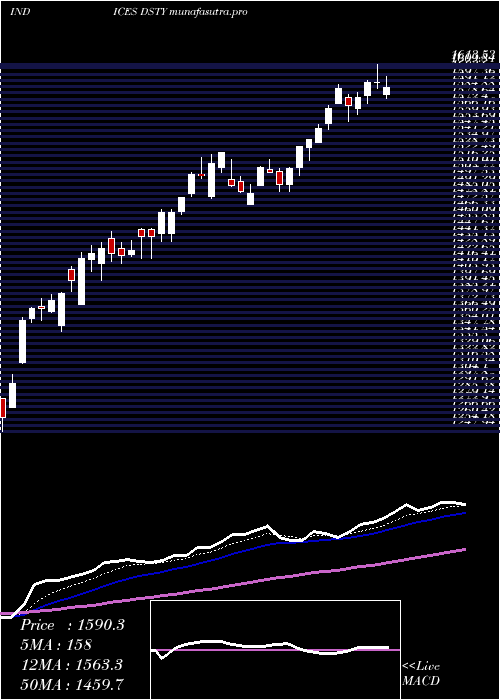
Daily price and volume Dj Us
| Date |
Closing |
Open |
Range |
Volume |
Mon 20 October 2025 |
2017.92 (0.76%) |
2011.69 |
1991.91 - 2025.58 |
0.8446 times |
Fri 17 October 2025 |
2002.78 (-0.26%) |
2007.83 |
1985.06 - 2019.76 |
0.9132 times |
Thu 16 October 2025 |
2008.02 (-1.53%) |
2041.89 |
1993.88 - 2042.81 |
1.0007 times |
Wed 15 October 2025 |
2039.25 (2.27%) |
2031.42 |
2023.51 - 2066.13 |
1.2004 times |
Tue 14 October 2025 |
1994.04 (1.96%) |
1954.62 |
1929.61 - 2024.99 |
1.167 times |
Mon 13 October 2025 |
1955.77 (1.11%) |
1938.33 |
1931.54 - 1963.29 |
0.8661 times |
Fri 10 October 2025 |
1934.23 (-0.75%) |
1948.52 |
1931.09 - 1975.20 |
1.1676 times |
Thu 09 October 2025 |
1948.84 (-0.08%) |
1950.83 |
1939.31 - 1954.72 |
0.9221 times |
Wed 08 October 2025 |
1950.48 (0.24%) |
1970.37 |
1937.85 - 1971.63 |
0.9104 times |
Tue 07 October 2025 |
1945.90 (-0.18%) |
1944.63 |
1925.31 - 1949.20 |
1.0082 times |
Mon 06 October 2025 |
1949.34 (1.08%) |
1939.65 |
1924.82 - 1960.82 |
1.6098 times |
Weekly price and charts DjUs Strong weekly Stock price targets for DjUs DSTY are 2004.92 and 2038.59 | Weekly Target 1 | 1978.13 | | Weekly Target 2 | 1998.03 | | Weekly Target 3 | 2011.8033333333 | | Weekly Target 4 | 2031.7 | | Weekly Target 5 | 2045.47 |
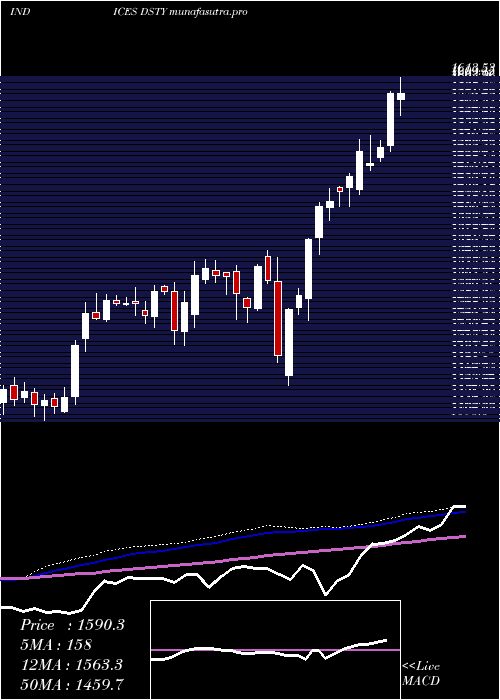
Weekly price and volumes for Dj Us
| Date |
Closing |
Open |
Range |
Volume |
Mon 20 October 2025 |
2017.92 (0.76%) |
2011.69 |
1991.91 - 2025.58 |
0.1736 times |
Fri 17 October 2025 |
2002.78 (3.54%) |
1938.33 |
1929.61 - 2066.13 |
1.0581 times |
Fri 10 October 2025 |
1934.23 (0.29%) |
1939.65 |
1924.82 - 1975.20 |
1.1549 times |
Fri 03 October 2025 |
1928.58 (-2.96%) |
2013.50 |
1914.22 - 2064.11 |
1.5172 times |
Fri 26 September 2025 |
1987.41 (2.99%) |
1933.60 |
1861.52 - 1988.60 |
1.1182 times |
Fri 19 September 2025 |
1929.72 (0.65%) |
1921.38 |
1884.96 - 1960.64 |
1.4522 times |
Fri 12 September 2025 |
1917.22 (2.65%) |
1889.84 |
1874.53 - 1940.65 |
1.0696 times |
Fri 05 September 2025 |
1867.71 (1.27%) |
1805.70 |
1796.96 - 1908.67 |
0.9856 times |
Fri 29 August 2025 |
1844.37 (0%) |
1854.15 |
1831.71 - 1858.91 |
0.2038 times |
Fri 29 August 2025 |
1844.37 (2.83%) |
1827.87 |
1820.55 - 1866.23 |
1.2666 times |
Fri 22 August 2025 |
1793.57 (-0.54%) |
1790.99 |
1759.31 - 1816.49 |
1.3315 times |
Monthly price and charts DjUs Strong monthly Stock price targets for DjUs DSTY are 1890.12 and 2042.03 | Monthly Target 1 | 1847.51 | | Monthly Target 2 | 1932.72 | | Monthly Target 3 | 1999.4233333333 | | Monthly Target 4 | 2084.63 | | Monthly Target 5 | 2151.33 |
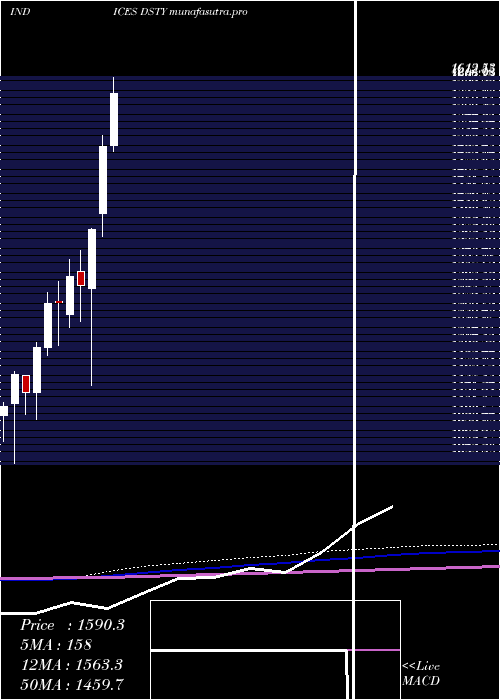
Monthly price and volumes Dj Us
| Date |
Closing |
Open |
Range |
Volume |
Mon 20 October 2025 |
2017.92 (-0.81%) |
2031.84 |
1914.22 - 2066.13 |
0.5273 times |
Tue 30 September 2025 |
2034.47 (10.31%) |
1805.70 |
1796.96 - 2064.11 |
0.9491 times |
Fri 29 August 2025 |
1844.37 (-0.01%) |
1811.04 |
1759.31 - 1897.08 |
1.0457 times |
Thu 31 July 2025 |
1844.53 (8.25%) |
1704.93 |
1662.13 - 1933.15 |
1.0936 times |
Mon 30 June 2025 |
1704.03 (12.9%) |
1511.12 |
1503.18 - 1704.03 |
0.9287 times |
Fri 30 May 2025 |
1509.35 (8.94%) |
1409.78 |
1374.26 - 1526.15 |
1.4318 times |
Wed 30 April 2025 |
1385.43 (6.52%) |
1296.70 |
1150.65 - 1386.32 |
0.996 times |
Mon 31 March 2025 |
1300.64 (-1.1%) |
1321.89 |
1246.06 - 1353.43 |
0.9126 times |
Fri 28 February 2025 |
1315.08 (3.09%) |
1257.30 |
1237.55 - 1340.19 |
1.2651 times |
Fri 31 January 2025 |
1275.64 (0.17%) |
1277.26 |
1211.22 - 1306.32 |
0.8503 times |
Tue 26 November 2024 |
1273.48 (5.4%) |
1207.24 |
1196.20 - 1289.76 |
0.9986 times |
DMA SMA EMA moving averages of Dj Us DSTY
DMA (daily moving average) of Dj Us DSTY
| DMA period | DMA value | | 5 day DMA | 2012.4 | | 12 day DMA | 1972.93 | | 20 day DMA | 1969.65 | | 35 day DMA | 1941.09 | | 50 day DMA | 1908.04 | | 100 day DMA | 1788.06 | | 150 day DMA | 1641.36 | | 200 day DMA | 1552.84 | EMA (exponential moving average) of Dj Us DSTY
| EMA period | EMA current | EMA prev | EMA prev2 | | 5 day EMA | 2004.69 | 1998.08 | 1995.73 | | 12 day EMA | 1986 | 1980.2 | 1976.1 | | 20 day EMA | 1969.78 | 1964.72 | 1960.72 | | 35 day EMA | 1939.44 | 1934.82 | 1930.82 | | 50 day EMA | 1911.01 | 1906.65 | 1902.73 |
SMA (simple moving average) of Dj Us DSTY
| SMA period | SMA current | SMA prev | SMA prev2 | | 5 day SMA | 2012.4 | 1999.97 | 1986.26 | | 12 day SMA | 1972.93 | 1971.42 | 1974.06 | | 20 day SMA | 1969.65 | 1965.24 | 1961.76 | | 35 day SMA | 1941.09 | 1936.13 | 1932.05 | | 50 day SMA | 1908.04 | 1904.03 | 1900.53 | | 100 day SMA | 1788.06 | 1782.82 | 1778.05 | | 150 day SMA | 1641.36 | 1636.58 | 1631.87 | | 200 day SMA | 1552.84 | 1549.15 | 1545.54 |
|
|
