US DSSR full analysis,charts,indicators,moving averages,SMA,DMA,EMA,ADX,MACD,RSIU S DSSR WideScreen charts, DMA,SMA,EMA technical analysis, forecast prediction, by indicators ADX,MACD,RSI,CCI INDICES stock exchange
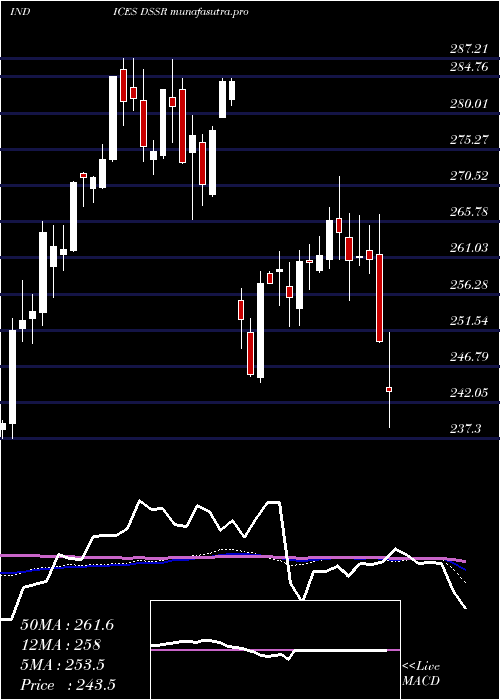
Daily price and charts and targets US Strong Daily Stock price targets for US DSSR are 254.63 and 257.28 | Daily Target 1 | 252.61 | | Daily Target 2 | 254 | | Daily Target 3 | 255.26333333333 | | Daily Target 4 | 256.65 | | Daily Target 5 | 257.91 |
Daily price and volume U S
| Date |
Closing |
Open |
Range |
Volume |
Thu 04 December 2025 |
255.38 (0.18%) |
253.88 |
253.88 - 256.53 |
0.9272 times |
Wed 03 December 2025 |
254.91 (0.1%) |
254.89 |
253.30 - 255.29 |
0.9999 times |
Tue 02 December 2025 |
254.66 (-0.24%) |
255.76 |
253.78 - 256.04 |
1.0332 times |
Mon 01 December 2025 |
255.27 (-1.89%) |
257.21 |
255.21 - 257.78 |
1.0843 times |
Fri 28 November 2025 |
260.20 (0.39%) |
258.75 |
258.75 - 261.04 |
0.4418 times |
Wed 26 November 2025 |
259.18 (0.71%) |
257.09 |
256.78 - 260.37 |
0.7787 times |
Tue 25 November 2025 |
257.36 (0.46%) |
256.93 |
256.79 - 258.51 |
1.0052 times |
Mon 24 November 2025 |
256.19 (0.22%) |
255.75 |
253.76 - 256.29 |
1.4055 times |
Fri 21 November 2025 |
255.62 (0.8%) |
254.31 |
253.13 - 257.02 |
1.2414 times |
Thu 20 November 2025 |
253.60 (-0.71%) |
256.82 |
253.54 - 257.95 |
1.0829 times |
Wed 19 November 2025 |
255.42 (-0.98%) |
257.80 |
254.30 - 258.00 |
0.9027 times |

Weekly price and charts US Strong weekly Stock price targets for US DSSR are 252.1 and 256.58 | Weekly Target 1 | 251.01 | | Weekly Target 2 | 253.19 | | Weekly Target 3 | 255.48666666667 | | Weekly Target 4 | 257.67 | | Weekly Target 5 | 259.97 |
Weekly price and volumes for U S
| Date |
Closing |
Open |
Range |
Volume |
Thu 04 December 2025 |
255.38 (-1.85%) |
257.21 |
253.30 - 257.78 |
1.0235 times |
Fri 28 November 2025 |
260.20 (1.79%) |
255.75 |
253.76 - 261.04 |
0.9189 times |
Fri 21 November 2025 |
255.62 (-0.97%) |
259.02 |
253.13 - 259.09 |
1.2888 times |
Fri 14 November 2025 |
258.12 (-1%) |
259.54 |
256.05 - 263.35 |
1.034 times |
Fri 07 November 2025 |
260.73 (0.97%) |
258.40 |
256.83 - 260.81 |
0.9316 times |
Fri 31 October 2025 |
258.23 (0%) |
255.48 |
255.06 - 259.42 |
0.3284 times |
Fri 31 October 2025 |
258.23 (-3.39%) |
266.96 |
254.79 - 268.42 |
1.4557 times |
Fri 24 October 2025 |
267.30 (1.06%) |
265.63 |
263.21 - 269.04 |
0.8624 times |
Fri 17 October 2025 |
264.49 (2.98%) |
256.33 |
255.70 - 265.94 |
1.1456 times |
Fri 10 October 2025 |
256.83 (-2.42%) |
263.04 |
256.28 - 263.04 |
1.0111 times |
Fri 03 October 2025 |
263.21 (0.32%) |
262.80 |
261.27 - 265.27 |
0.772 times |
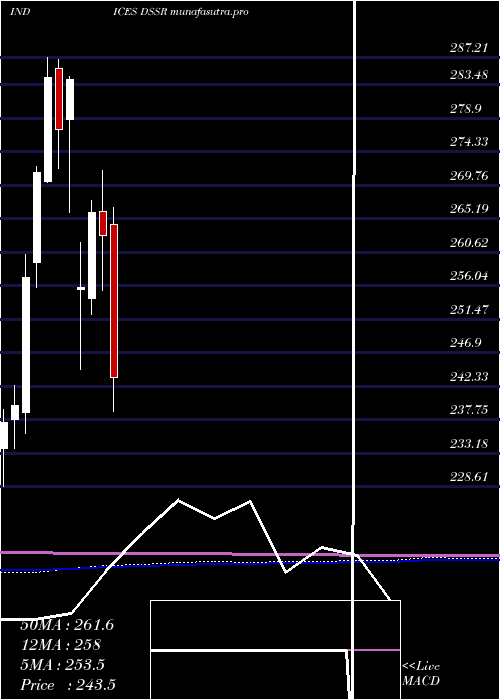
Monthly price and charts US Strong monthly Stock price targets for US DSSR are 252.1 and 256.58 | Monthly Target 1 | 251.01 | | Monthly Target 2 | 253.19 | | Monthly Target 3 | 255.48666666667 | | Monthly Target 4 | 257.67 | | Monthly Target 5 | 259.97 |
Monthly price and volumes U S
| Date |
Closing |
Open |
Range |
Volume |
Thu 04 December 2025 |
255.38 (-1.85%) |
257.21 |
253.30 - 257.78 |
0.263 times |
Fri 28 November 2025 |
260.20 (0.76%) |
258.40 |
253.13 - 263.35 |
1.0725 times |
Fri 31 October 2025 |
258.23 (-2.06%) |
263.86 |
254.79 - 269.04 |
1.322 times |
Tue 30 September 2025 |
263.65 (0.03%) |
261.71 |
257.00 - 264.71 |
1.1717 times |
Fri 29 August 2025 |
263.58 (0.76%) |
265.67 |
256.68 - 267.49 |
1.0341 times |
Thu 31 July 2025 |
261.59 (-0.82%) |
263.39 |
260.49 - 273.52 |
0.9946 times |
Mon 30 June 2025 |
263.76 (-0.75%) |
264.39 |
256.43 - 271.49 |
0.9816 times |
Fri 30 May 2025 |
265.75 (0%) |
265.40 |
255.60 - 268.28 |
1.163 times |
Wed 30 April 2025 |
265.75 (1.1%) |
264.47 |
229.30 - 266.72 |
1.0543 times |
Mon 31 March 2025 |
262.86 (-1.17%) |
266.22 |
255.39 - 271.77 |
0.9432 times |
Fri 28 February 2025 |
265.98 (3.95%) |
254.34 |
252.14 - 267.64 |
0.9192 times |
DMA SMA EMA moving averages of U S DSSR
DMA (daily moving average) of U S DSSR
| DMA period | DMA value | | 5 day DMA | 256.08 | | 12 day DMA | 256.31 | | 20 day DMA | 257.48 | | 35 day DMA | 259.56 | | 50 day DMA | 259.97 | | 100 day DMA | 261.45 | | 150 day DMA | 262.3 | | 200 day DMA | 261.61 | EMA (exponential moving average) of U S DSSR
| EMA period | EMA current | EMA prev | EMA prev2 | | 5 day EMA | 255.73 | 255.91 | 256.41 | | 12 day EMA | 256.54 | 256.75 | 257.08 | | 20 day EMA | 257.32 | 257.52 | 257.8 | | 35 day EMA | 258.43 | 258.61 | 258.83 | | 50 day EMA | 259.56 | 259.73 | 259.93 |
SMA (simple moving average) of U S DSSR
| SMA period | SMA current | SMA prev | SMA prev2 | | 5 day SMA | 256.08 | 256.84 | 257.33 | | 12 day SMA | 256.31 | 256.41 | 256.68 | | 20 day SMA | 257.48 | 257.62 | 257.79 | | 35 day SMA | 259.56 | 259.79 | 259.94 | | 50 day SMA | 259.97 | 260.11 | 260.21 | | 100 day SMA | 261.45 | 261.53 | 261.6 | | 150 day SMA | 262.3 | 262.35 | 262.37 | | 200 day SMA | 261.61 | 261.63 | 261.63 |
|
|
