US DSRN full analysis,charts,indicators,moving averages,SMA,DMA,EMA,ADX,MACD,RSIU S DSRN WideScreen charts, DMA,SMA,EMA technical analysis, forecast prediction, by indicators ADX,MACD,RSI,CCI INDICES stock exchange
Daily price and charts and targets US Strong Daily Stock price targets for US DSRN are 218.02 and 219.67 | Daily Target 1 | 216.82 | | Daily Target 2 | 217.57 | | Daily Target 3 | 218.47 | | Daily Target 4 | 219.22 | | Daily Target 5 | 220.12 |
Daily price and volume U S
| Date |
Closing |
Open |
Range |
Volume |
Mon 20 October 2025 |
218.32 (0.34%) |
218.10 |
217.72 - 219.37 |
0.7673 times |
Fri 17 October 2025 |
217.59 (0.74%) |
216.39 |
215.55 - 217.84 |
1.0715 times |
Thu 16 October 2025 |
216.00 (-0.21%) |
216.55 |
215.02 - 217.68 |
1.1281 times |
Wed 15 October 2025 |
216.45 (-0.49%) |
217.53 |
215.82 - 219.44 |
1.0635 times |
Tue 14 October 2025 |
217.51 (0.43%) |
216.93 |
215.78 - 217.76 |
1.1396 times |
Mon 13 October 2025 |
216.57 (0.2%) |
215.75 |
215.51 - 216.90 |
0.9339 times |
Fri 10 October 2025 |
216.13 (-0.3%) |
217.48 |
214.79 - 217.97 |
1.1478 times |
Thu 09 October 2025 |
216.77 (-0.75%) |
218.98 |
216.15 - 219.34 |
0.8966 times |
Wed 08 October 2025 |
218.40 (-0.08%) |
218.37 |
216.91 - 219.01 |
0.9397 times |
Tue 07 October 2025 |
218.58 (0.02%) |
219.07 |
217.79 - 220.80 |
0.9121 times |
Mon 06 October 2025 |
218.54 (-1.24%) |
221.71 |
218.40 - 221.71 |
1.0345 times |
Weekly price and charts US Strong weekly Stock price targets for US DSRN are 218.02 and 219.67 | Weekly Target 1 | 216.82 | | Weekly Target 2 | 217.57 | | Weekly Target 3 | 218.47 | | Weekly Target 4 | 219.22 | | Weekly Target 5 | 220.12 |
Weekly price and volumes for U S
| Date |
Closing |
Open |
Range |
Volume |
Mon 20 October 2025 |
218.32 (0.34%) |
218.10 |
217.72 - 219.37 |
0.2005 times |
Fri 17 October 2025 |
217.59 (0.68%) |
215.75 |
215.02 - 219.44 |
1.3941 times |
Fri 10 October 2025 |
216.13 (-2.33%) |
221.71 |
214.79 - 221.71 |
1.2881 times |
Fri 03 October 2025 |
221.28 (-1.11%) |
222.92 |
221.05 - 225.11 |
0.9813 times |
Fri 26 September 2025 |
223.76 (-0.57%) |
225.09 |
221.46 - 226.06 |
1.2232 times |
Fri 19 September 2025 |
225.04 (-1.4%) |
228.52 |
223.59 - 228.92 |
1.591 times |
Fri 12 September 2025 |
228.23 (-0.79%) |
228.14 |
225.85 - 230.81 |
1.045 times |
Fri 05 September 2025 |
230.04 (-0.3%) |
229.04 |
223.25 - 231.50 |
1.0251 times |
Fri 29 August 2025 |
230.73 (0%) |
228.39 |
228.21 - 230.86 |
0.2069 times |
Fri 29 August 2025 |
230.73 (0.94%) |
228.21 |
225.47 - 230.86 |
1.0448 times |
Fri 22 August 2025 |
228.59 (1.64%) |
225.27 |
221.95 - 229.89 |
1.0561 times |
Monthly price and charts US Strong monthly Stock price targets for US DSRN are 211.4 and 221.72 | Monthly Target 1 | 209.09 | | Monthly Target 2 | 213.7 | | Monthly Target 3 | 219.40666666667 | | Monthly Target 4 | 224.02 | | Monthly Target 5 | 229.73 |
Monthly price and volumes U S
| Date |
Closing |
Open |
Range |
Volume |
Mon 20 October 2025 |
218.32 (-2.67%) |
223.85 |
214.79 - 225.11 |
0.7676 times |
Tue 30 September 2025 |
224.31 (-2.78%) |
229.04 |
221.12 - 231.50 |
1.249 times |
Fri 29 August 2025 |
230.73 (3.08%) |
226.43 |
218.60 - 230.86 |
1.0939 times |
Thu 31 July 2025 |
223.84 (-5.44%) |
236.43 |
223.40 - 239.96 |
1.051 times |
Mon 30 June 2025 |
236.72 (-2.42%) |
240.92 |
232.53 - 243.31 |
1.0073 times |
Fri 30 May 2025 |
242.58 (-0.16%) |
242.74 |
233.45 - 252.44 |
1.1356 times |
Wed 30 April 2025 |
242.98 (-3.91%) |
253.71 |
212.81 - 254.00 |
0.9996 times |
Mon 31 March 2025 |
252.87 (-1.97%) |
257.64 |
241.34 - 263.03 |
0.8361 times |
Fri 28 February 2025 |
257.94 (6.77%) |
239.79 |
237.24 - 259.01 |
0.8868 times |
Fri 31 January 2025 |
241.58 (-7.33%) |
244.40 |
231.99 - 244.78 |
0.9729 times |
Tue 26 November 2024 |
260.70 (6.66%) |
243.28 |
240.10 - 261.51 |
0.9212 times |

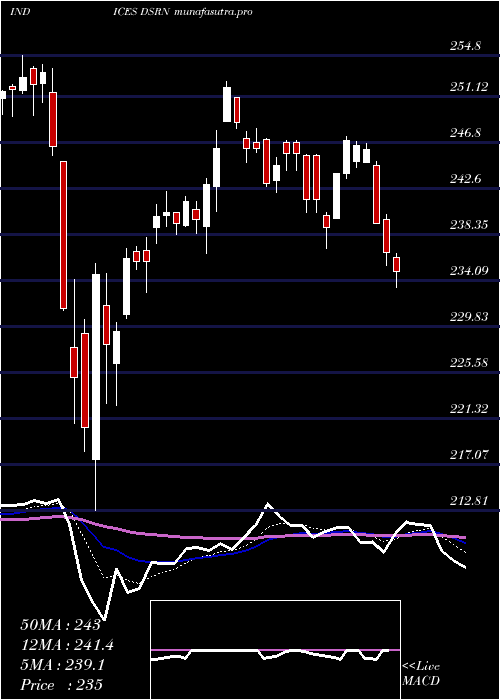
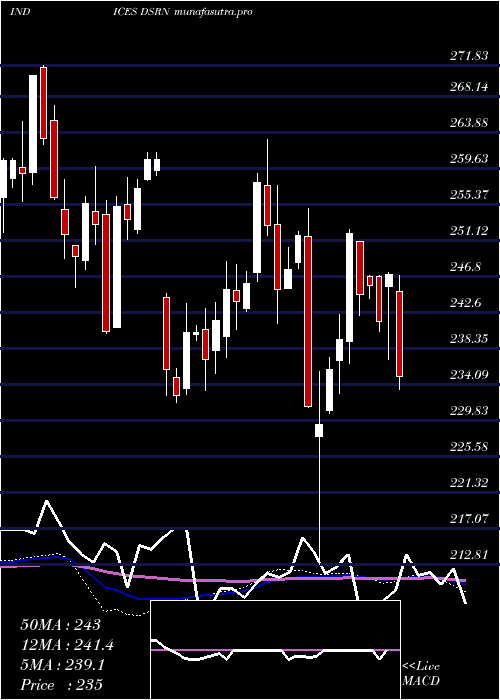
DMA SMA EMA moving averages of U S DSRN
DMA (daily moving average) of U S DSRN
| DMA period | DMA value | | 5 day DMA | 217.17 | | 12 day DMA | 217.68 | | 20 day DMA | 220.08 | | 35 day DMA | 223.03 | | 50 day DMA | 223.76 | | 100 day DMA | 229.86 | | 150 day DMA | 234.37 | | 200 day DMA | 237.17 | EMA (exponential moving average) of U S DSRN
| EMA period | EMA current | EMA prev | EMA prev2 | | 5 day EMA | 217.46 | 217.03 | 216.75 | | 12 day EMA | 218.29 | 218.29 | 218.42 | | 20 day EMA | 219.63 | 219.77 | 220 | | 35 day EMA | 221.27 | 221.44 | 221.67 | | 50 day EMA | 223.04 | 223.23 | 223.46 |
SMA (simple moving average) of U S DSRN
| SMA period | SMA current | SMA prev | SMA prev2 | | 5 day SMA | 217.17 | 216.82 | 216.53 | | 12 day SMA | 217.68 | 218.03 | 218.59 | | 20 day SMA | 220.08 | 220.42 | 220.77 | | 35 day SMA | 223.03 | 223.39 | 223.7 | | 50 day SMA | 223.76 | 223.83 | 223.95 | | 100 day SMA | 229.86 | 230.07 | 230.36 | | 150 day SMA | 234.37 | 234.62 | 234.91 | | 200 day SMA | 237.17 | 237.34 | 237.54 |
|
|
