DjUs DSOS full analysis,charts,indicators,moving averages,SMA,DMA,EMA,ADX,MACD,RSIDj Us DSOS WideScreen charts, DMA,SMA,EMA technical analysis, forecast prediction, by indicators ADX,MACD,RSI,CCI INDICES stock exchange
Daily price and charts and targets DjUs Strong Daily Stock price targets for DjUs DSOS are 1069.54 and 1082.63 | Daily Target 1 | 1059.44 | | Daily Target 2 | 1066.54 | | Daily Target 3 | 1072.5333333333 | | Daily Target 4 | 1079.63 | | Daily Target 5 | 1085.62 |
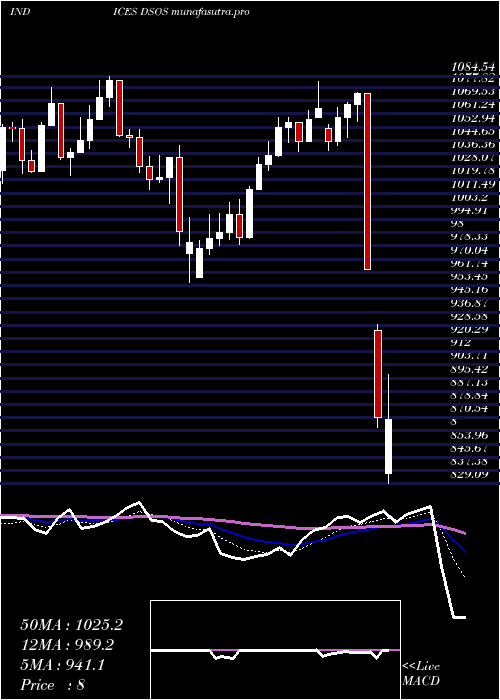
Daily price and volume Dj Us
| Date |
Closing |
Open |
Range |
Volume |
Thu 04 December 2025 |
1073.63 (0.16%) |
1071.53 |
1065.44 - 1078.53 |
1.037 times |
Wed 03 December 2025 |
1071.92 (2.1%) |
1057.34 |
1056.60 - 1073.25 |
1.0975 times |
Tue 02 December 2025 |
1049.87 (-1.44%) |
1059.94 |
1044.77 - 1060.48 |
1.0208 times |
Mon 01 December 2025 |
1065.18 (1.23%) |
1052.23 |
1052.23 - 1072.44 |
1.0624 times |
Fri 28 November 2025 |
1052.23 (1.74%) |
1034.20 |
1034.20 - 1057.50 |
0.4638 times |
Wed 26 November 2025 |
1034.20 (1.18%) |
1022.15 |
1022.15 - 1042.15 |
0.8453 times |
Tue 25 November 2025 |
1022.15 (-0.64%) |
1028.73 |
1009.27 - 1028.73 |
0.9117 times |
Mon 24 November 2025 |
1028.73 (0.34%) |
1025.28 |
1005.62 - 1033.36 |
1.255 times |
Fri 21 November 2025 |
1025.28 (0.87%) |
1016.47 |
1008.86 - 1032.80 |
1.1181 times |
Thu 20 November 2025 |
1016.47 (-2.3%) |
1040.42 |
1016.00 - 1064.86 |
1.1882 times |
Wed 19 November 2025 |
1040.42 (-1.63%) |
1057.62 |
1025.76 - 1057.62 |
1.0694 times |
Weekly price and charts DjUs Strong weekly Stock price targets for DjUs DSOS are 1059.2 and 1092.96 | Weekly Target 1 | 1031.88 | | Weekly Target 2 | 1052.76 | | Weekly Target 3 | 1065.6433333333 | | Weekly Target 4 | 1086.52 | | Weekly Target 5 | 1099.4 |
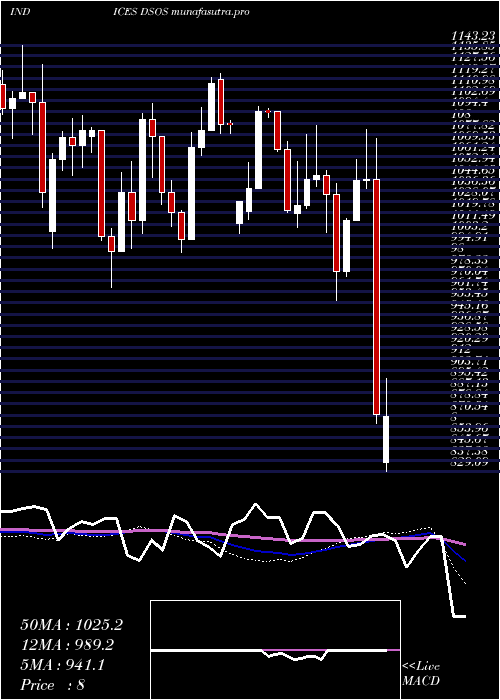
Weekly price and volumes for Dj Us
| Date |
Closing |
Open |
Range |
Volume |
Thu 04 December 2025 |
1073.63 (2.03%) |
1052.23 |
1044.77 - 1078.53 |
0.9208 times |
Fri 28 November 2025 |
1052.23 (2.63%) |
1025.28 |
1005.62 - 1057.50 |
0.7588 times |
Fri 21 November 2025 |
1025.28 (-4.02%) |
1068.22 |
1008.86 - 1068.22 |
1.1937 times |
Fri 14 November 2025 |
1068.22 (3.79%) |
1029.25 |
1022.89 - 1071.10 |
1.2619 times |
Fri 07 November 2025 |
1029.25 (1.96%) |
998.56 |
989.12 - 1035.39 |
1.1341 times |
Fri 31 October 2025 |
1009.43 (0%) |
1003.11 |
1002.15 - 1014.16 |
0.2072 times |
Fri 31 October 2025 |
1009.43 (-0.47%) |
1014.24 |
996.04 - 1021.90 |
1.0441 times |
Fri 24 October 2025 |
1014.24 (3.27%) |
982.11 |
979.50 - 1030.96 |
1.0861 times |
Fri 17 October 2025 |
982.11 (-0.01%) |
982.19 |
969.44 - 1007.39 |
1.1757 times |
Fri 10 October 2025 |
982.19 (-5.39%) |
1038.20 |
982.19 - 1053.99 |
1.2176 times |
Fri 03 October 2025 |
1038.20 (-3.72%) |
1078.27 |
1036.25 - 1078.27 |
0.9467 times |
Monthly price and charts DjUs Strong monthly Stock price targets for DjUs DSOS are 1059.2 and 1092.96 | Monthly Target 1 | 1031.88 | | Monthly Target 2 | 1052.76 | | Monthly Target 3 | 1065.6433333333 | | Monthly Target 4 | 1086.52 | | Monthly Target 5 | 1099.4 |
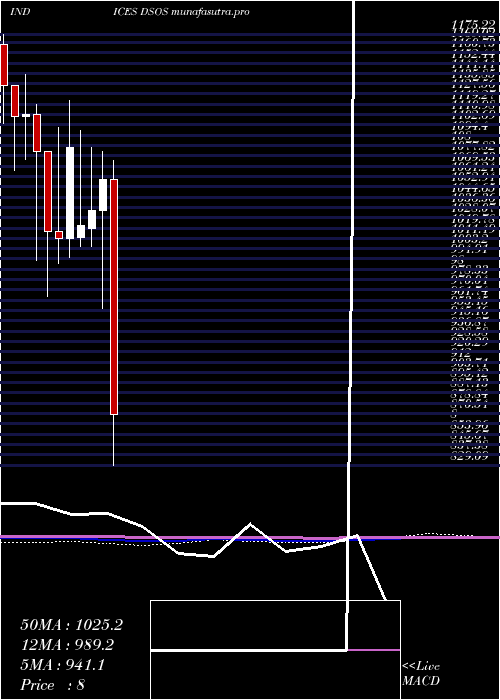
Monthly price and volumes Dj Us
| Date |
Closing |
Open |
Range |
Volume |
Thu 04 December 2025 |
1073.63 (2.03%) |
1052.23 |
1044.77 - 1078.53 |
0.2109 times |
Fri 28 November 2025 |
1052.23 (4.24%) |
998.56 |
989.12 - 1071.10 |
0.9958 times |
Fri 31 October 2025 |
1009.43 (-3.42%) |
1045.13 |
969.44 - 1054.28 |
1.1818 times |
Tue 30 September 2025 |
1045.13 (-0.17%) |
1046.94 |
1001.81 - 1092.54 |
1.1352 times |
Fri 29 August 2025 |
1046.94 (3.53%) |
1011.26 |
965.17 - 1051.77 |
0.9374 times |
Thu 31 July 2025 |
1011.26 (2.1%) |
990.49 |
982.42 - 1047.04 |
1.0014 times |
Mon 30 June 2025 |
990.49 (5.05%) |
942.87 |
942.84 - 1052.74 |
1.0807 times |
Fri 30 May 2025 |
942.87 (3.39%) |
911.93 |
908.37 - 1019.15 |
1.2407 times |
Wed 30 April 2025 |
911.93 (-13.87%) |
1058.77 |
821.29 - 1074.43 |
1.1818 times |
Mon 31 March 2025 |
1058.77 (2.44%) |
1033.59 |
955.29 - 1081.43 |
1.0343 times |
Fri 28 February 2025 |
1033.59 (1.15%) |
1019.40 |
1005.13 - 1084.54 |
0.9923 times |
DMA SMA EMA moving averages of Dj Us DSOS
DMA (daily moving average) of Dj Us DSOS
| DMA period | DMA value | | 5 day DMA | 1062.57 | | 12 day DMA | 1044.81 | | 20 day DMA | 1045.12 | | 35 day DMA | 1026.8 | | 50 day DMA | 1029.11 | | 100 day DMA | 1020.42 | | 150 day DMA | 1007.92 | | 200 day DMA | 1004.42 | EMA (exponential moving average) of Dj Us DSOS
| EMA period | EMA current | EMA prev | EMA prev2 | | 5 day EMA | 1061.81 | 1055.9 | 1047.89 | | 12 day EMA | 1050.55 | 1046.36 | 1041.71 | | 20 day EMA | 1043.86 | 1040.73 | 1037.45 | | 35 day EMA | 1038.35 | 1036.27 | 1034.17 | | 50 day EMA | 1032.21 | 1030.52 | 1028.83 |
SMA (simple moving average) of Dj Us DSOS
| SMA period | SMA current | SMA prev | SMA prev2 | | 5 day SMA | 1062.57 | 1054.68 | 1044.73 | | 12 day SMA | 1044.81 | 1042.4 | 1042.09 | | 20 day SMA | 1045.12 | 1041.7 | 1038.45 | | 35 day SMA | 1026.8 | 1024.6 | 1022.39 | | 50 day SMA | 1029.11 | 1028.37 | 1027.27 | | 100 day SMA | 1020.42 | 1020.09 | 1019.69 | | 150 day SMA | 1007.92 | 1007 | 1006.12 | | 200 day SMA | 1004.42 | 1004.31 | 1004.22 |
|
|
