DjUs DSNG full analysis,charts,indicators,moving averages,SMA,DMA,EMA,ADX,MACD,RSIDj Us DSNG WideScreen charts, DMA,SMA,EMA technical analysis, forecast prediction, by indicators ADX,MACD,RSI,CCI INDICES stock exchange
Daily price and charts and targets DjUs Strong Daily Stock price targets for DjUs DSNG are 1024.85 and 1032.05 | Daily Target 1 | 1023.43 | | Daily Target 2 | 1026.27 | | Daily Target 3 | 1030.6266666667 | | Daily Target 4 | 1033.47 | | Daily Target 5 | 1037.83 |
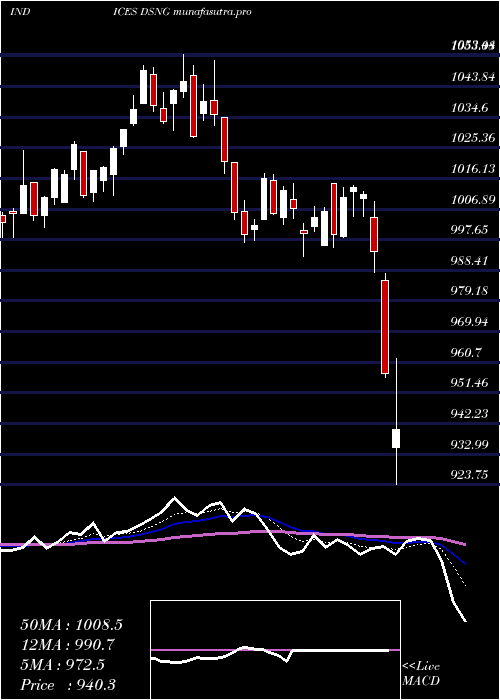
Daily price and volume Dj Us
| Date |
Closing |
Open |
Range |
Volume |
Mon 20 October 2025 |
1029.12 (0.09%) |
1030.87 |
1027.78 - 1034.98 |
0.8648 times |
Fri 17 October 2025 |
1028.23 (1.11%) |
1021.00 |
1019.79 - 1029.94 |
1.0399 times |
Thu 16 October 2025 |
1016.91 (-0.56%) |
1024.08 |
1014.20 - 1027.50 |
1.3536 times |
Wed 15 October 2025 |
1022.64 (-0.25%) |
1027.12 |
1022.23 - 1034.60 |
0.8361 times |
Tue 14 October 2025 |
1025.16 (1.14%) |
1011.47 |
1008.96 - 1025.72 |
0.8419 times |
Mon 13 October 2025 |
1013.65 (-0.1%) |
1017.14 |
1008.04 - 1017.14 |
0.9105 times |
Fri 10 October 2025 |
1014.64 (-0.51%) |
1023.33 |
1014.48 - 1025.60 |
1.1668 times |
Thu 09 October 2025 |
1019.87 (-0.37%) |
1023.31 |
1016.57 - 1023.31 |
1.0551 times |
Wed 08 October 2025 |
1023.68 (-0.36%) |
1028.44 |
1018.92 - 1028.63 |
0.9155 times |
Tue 07 October 2025 |
1027.35 (0.15%) |
1025.56 |
1020.31 - 1028.57 |
1.0159 times |
Mon 06 October 2025 |
1025.80 (-0.6%) |
1030.50 |
1024.59 - 1031.35 |
0.9606 times |
Weekly price and charts DjUs Strong weekly Stock price targets for DjUs DSNG are 1024.85 and 1032.05 | Weekly Target 1 | 1023.43 | | Weekly Target 2 | 1026.27 | | Weekly Target 3 | 1030.6266666667 | | Weekly Target 4 | 1033.47 | | Weekly Target 5 | 1037.83 |
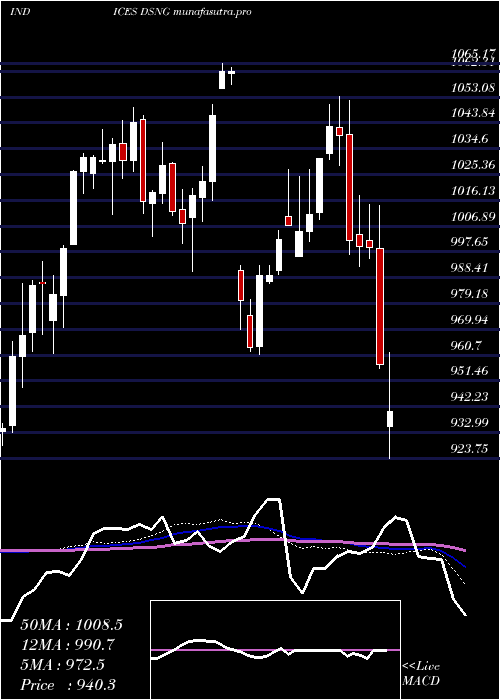
Weekly price and volumes for Dj Us
| Date |
Closing |
Open |
Range |
Volume |
Mon 20 October 2025 |
1029.12 (0.09%) |
1030.87 |
1027.78 - 1034.98 |
0.195 times |
Fri 17 October 2025 |
1028.23 (1.34%) |
1017.14 |
1008.04 - 1034.60 |
1.1233 times |
Fri 10 October 2025 |
1014.64 (-1.68%) |
1030.50 |
1014.48 - 1031.35 |
1.153 times |
Fri 03 October 2025 |
1031.96 (-1.05%) |
1045.67 |
1031.34 - 1052.85 |
1.0788 times |
Fri 26 September 2025 |
1042.88 (-0.84%) |
1048.47 |
1029.22 - 1048.47 |
1.315 times |
Fri 19 September 2025 |
1051.75 (-1.56%) |
1067.28 |
1051.40 - 1073.77 |
1.4149 times |
Fri 12 September 2025 |
1068.39 (-0.38%) |
1072.05 |
1058.32 - 1080.37 |
1.2318 times |
Fri 05 September 2025 |
1072.42 (0.24%) |
1062.92 |
1061.82 - 1079.20 |
1.1614 times |
Fri 29 August 2025 |
1069.83 (0%) |
1066.07 |
1065.30 - 1071.34 |
0.1997 times |
Fri 29 August 2025 |
1069.83 (-0.83%) |
1079.18 |
1059.15 - 1081.16 |
1.1272 times |
Fri 22 August 2025 |
1078.81 (2.13%) |
1055.75 |
1054.45 - 1080.91 |
1.1652 times |
Monthly price and charts DjUs Strong monthly Stock price targets for DjUs DSNG are 996.18 and 1040.99 | Monthly Target 1 | 985.19 | | Monthly Target 2 | 1007.16 | | Monthly Target 3 | 1030.0033333333 | | Monthly Target 4 | 1051.97 | | Monthly Target 5 | 1074.81 |
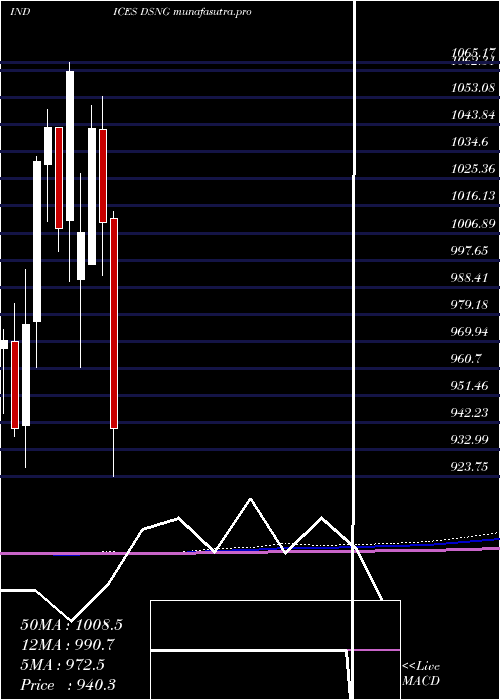
Monthly price and volumes Dj Us
| Date |
Closing |
Open |
Range |
Volume |
Mon 20 October 2025 |
1029.12 (-1.79%) |
1052.53 |
1008.04 - 1052.85 |
0.602 times |
Tue 30 September 2025 |
1047.89 (-2.05%) |
1062.92 |
1029.22 - 1080.37 |
1.1344 times |
Fri 29 August 2025 |
1069.83 (4.04%) |
1028.97 |
1022.95 - 1081.16 |
0.9962 times |
Thu 31 July 2025 |
1028.33 (-1.12%) |
1041.16 |
1026.31 - 1058.38 |
1.0473 times |
Mon 30 June 2025 |
1039.95 (-0.22%) |
1040.44 |
1013.86 - 1045.66 |
1.0234 times |
Fri 30 May 2025 |
1042.21 (4.78%) |
989.11 |
983.27 - 1045.21 |
1.2677 times |
Wed 30 April 2025 |
994.71 (-1.56%) |
1012.02 |
910.19 - 1014.13 |
1.1737 times |
Mon 31 March 2025 |
1010.48 (-3.09%) |
1042.30 |
992.49 - 1053.44 |
0.9184 times |
Fri 28 February 2025 |
1042.73 (3.53%) |
996.00 |
996.00 - 1050.29 |
1.0313 times |
Fri 31 January 2025 |
1007.22 (-5.16%) |
991.04 |
960.86 - 1027.16 |
0.8056 times |
Tue 26 November 2024 |
1062.04 (5.31%) |
1011.20 |
990.56 - 1065.17 |
0.8219 times |
DMA SMA EMA moving averages of Dj Us DSNG
DMA (daily moving average) of Dj Us DSNG
| DMA period | DMA value | | 5 day DMA | 1024.41 | | 12 day DMA | 1023.25 | | 20 day DMA | 1030.66 | | 35 day DMA | 1046.27 | | 50 day DMA | 1051.88 | | 100 day DMA | 1044.49 | | 150 day DMA | 1028.83 | | 200 day DMA | 1025.11 | EMA (exponential moving average) of Dj Us DSNG
| EMA period | EMA current | EMA prev | EMA prev2 | | 5 day EMA | 1024.97 | 1022.89 | 1020.22 | | 12 day EMA | 1026.78 | 1026.35 | 1026.01 | | 20 day EMA | 1031.86 | 1032.15 | 1032.56 | | 35 day EMA | 1039.16 | 1039.75 | 1040.43 | | 50 day EMA | 1048.18 | 1048.96 | 1049.81 |
SMA (simple moving average) of Dj Us DSNG
| SMA period | SMA current | SMA prev | SMA prev2 | | 5 day SMA | 1024.41 | 1021.32 | 1018.6 | | 12 day SMA | 1023.25 | 1024.78 | 1026.42 | | 20 day SMA | 1030.66 | 1031.79 | 1033.21 | | 35 day SMA | 1046.27 | 1047.44 | 1048.52 | | 50 day SMA | 1051.88 | 1052.24 | 1052.57 | | 100 day SMA | 1044.49 | 1044.45 | 1044.54 | | 150 day SMA | 1028.83 | 1028.83 | 1028.94 | | 200 day SMA | 1025.11 | 1025.06 | 1024.98 |
|
|
