DjUs DSNC full analysis,charts,indicators,moving averages,SMA,DMA,EMA,ADX,MACD,RSIDj Us DSNC WideScreen charts, DMA,SMA,EMA technical analysis, forecast prediction, by indicators ADX,MACD,RSI,CCI INDICES stock exchange
Daily price and charts and targets DjUs Strong Daily Stock price targets for DjUs DSNC are 1033.75 and 1042.11 | Daily Target 1 | 1028.04 | | Daily Target 2 | 1031.1 | | Daily Target 3 | 1036.3966666667 | | Daily Target 4 | 1039.46 | | Daily Target 5 | 1044.76 |
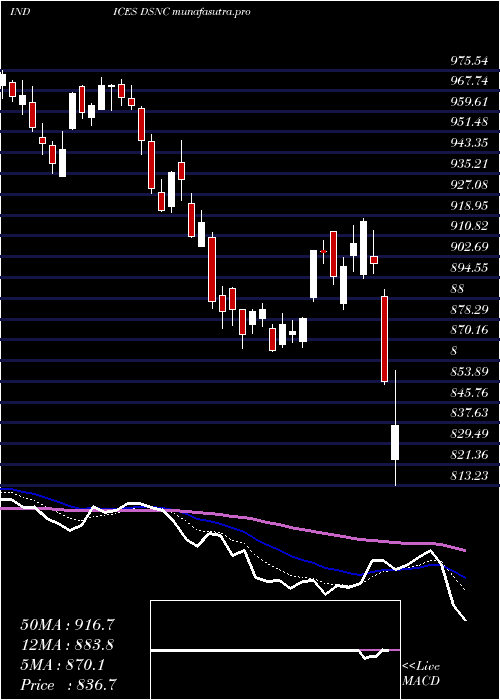
Daily price and volume Dj Us
| Date |
Closing |
Open |
Range |
Volume |
Fri 05 December 2025 |
1034.17 (-0.22%) |
1034.16 |
1033.33 - 1041.69 |
0.905 times |
Thu 04 December 2025 |
1036.40 (0.22%) |
1035.81 |
1029.29 - 1039.77 |
0.9896 times |
Wed 03 December 2025 |
1034.08 (1.42%) |
1024.17 |
1023.06 - 1036.32 |
0.9962 times |
Tue 02 December 2025 |
1019.61 (-0.62%) |
1025.26 |
1011.38 - 1025.26 |
1.0192 times |
Mon 01 December 2025 |
1026.00 (-0.21%) |
1022.63 |
1022.24 - 1029.01 |
0.9884 times |
Fri 28 November 2025 |
1028.21 (0.56%) |
1022.76 |
1022.37 - 1029.12 |
0.4588 times |
Wed 26 November 2025 |
1022.52 (0.98%) |
1015.98 |
1013.53 - 1024.01 |
0.9014 times |
Tue 25 November 2025 |
1012.61 (1.23%) |
998.73 |
998.22 - 1013.36 |
1.0506 times |
Mon 24 November 2025 |
1000.27 (1.49%) |
992.55 |
991.67 - 1004.12 |
1.4279 times |
Fri 21 November 2025 |
985.57 (0.86%) |
984.67 |
978.58 - 995.95 |
1.2629 times |
Thu 20 November 2025 |
977.20 (-0.93%) |
995.48 |
976.87 - 1006.91 |
1.2192 times |
Weekly price and charts DjUs Strong weekly Stock price targets for DjUs DSNC are 1022.78 and 1053.09 | Weekly Target 1 | 998.77 | | Weekly Target 2 | 1016.47 | | Weekly Target 3 | 1029.08 | | Weekly Target 4 | 1046.78 | | Weekly Target 5 | 1059.39 |
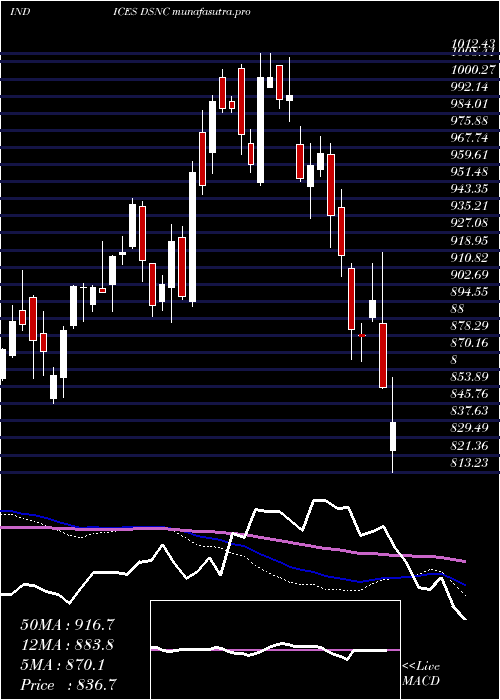
Weekly price and volumes for Dj Us
| Date |
Closing |
Open |
Range |
Volume |
Fri 05 December 2025 |
1034.17 (0.58%) |
1022.63 |
1011.38 - 1041.69 |
0.9514 times |
Fri 28 November 2025 |
1028.21 (4.33%) |
992.55 |
991.67 - 1029.12 |
0.7456 times |
Fri 21 November 2025 |
985.57 (-0.69%) |
987.86 |
976.87 - 1006.91 |
1.1164 times |
Fri 14 November 2025 |
992.39 (-1.51%) |
1015.63 |
979.73 - 1027.13 |
1.1161 times |
Fri 07 November 2025 |
1007.63 (-2.22%) |
1018.59 |
1000.21 - 1031.08 |
1.091 times |
Fri 31 October 2025 |
1030.55 (0%) |
1021.85 |
1018.57 - 1031.10 |
0.2422 times |
Fri 31 October 2025 |
1030.55 (-0.96%) |
1046.78 |
1018.57 - 1063.73 |
1.2304 times |
Fri 24 October 2025 |
1040.58 (-0.18%) |
1046.89 |
1026.91 - 1059.19 |
1.438 times |
Fri 17 October 2025 |
1042.43 (3.22%) |
1017.50 |
1011.05 - 1044.60 |
1.0171 times |
Fri 10 October 2025 |
1009.95 (-2.1%) |
1038.29 |
1008.52 - 1044.45 |
1.052 times |
Fri 03 October 2025 |
1031.63 (-0.76%) |
1044.27 |
1022.60 - 1062.33 |
0.9115 times |
Monthly price and charts DjUs Strong monthly Stock price targets for DjUs DSNC are 1022.78 and 1053.09 | Monthly Target 1 | 998.77 | | Monthly Target 2 | 1016.47 | | Monthly Target 3 | 1029.08 | | Monthly Target 4 | 1046.78 | | Monthly Target 5 | 1059.39 |
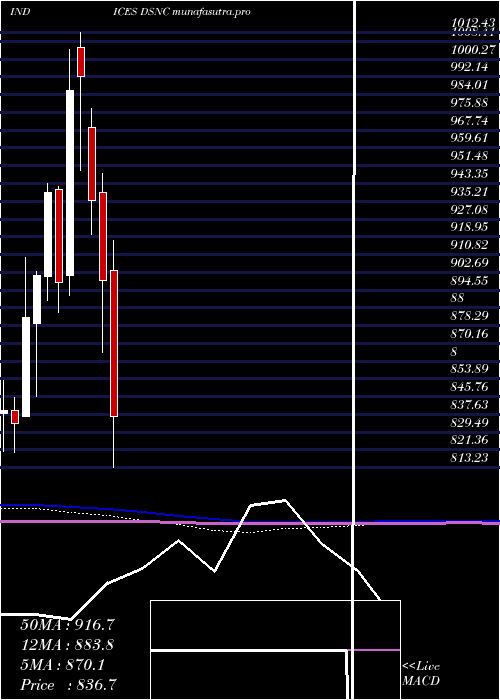
Monthly price and volumes Dj Us
| Date |
Closing |
Open |
Range |
Volume |
Fri 05 December 2025 |
1034.17 (0.58%) |
1022.63 |
1011.38 - 1041.69 |
0.1962 times |
Fri 28 November 2025 |
1028.21 (-0.23%) |
1018.59 |
976.87 - 1031.08 |
0.8394 times |
Fri 31 October 2025 |
1030.55 (-1.45%) |
1047.73 |
1008.52 - 1063.73 |
1.1214 times |
Tue 30 September 2025 |
1045.75 (6.96%) |
972.42 |
969.90 - 1049.21 |
0.991 times |
Fri 29 August 2025 |
977.71 (4.94%) |
931.53 |
923.43 - 993.21 |
0.9789 times |
Thu 31 July 2025 |
931.69 (-1.28%) |
929.69 |
925.75 - 971.50 |
1.1264 times |
Mon 30 June 2025 |
943.73 (-2.65%) |
965.65 |
904.77 - 973.64 |
1.1379 times |
Fri 30 May 2025 |
969.37 (7.28%) |
898.90 |
889.24 - 981.92 |
1.3276 times |
Wed 30 April 2025 |
903.55 (0.53%) |
903.29 |
805.67 - 917.51 |
1.2164 times |
Mon 31 March 2025 |
898.78 (-3.92%) |
939.37 |
865.76 - 947.91 |
1.0647 times |
Fri 28 February 2025 |
935.49 (-5.73%) |
969.05 |
920.07 - 977.52 |
1.0006 times |
DMA SMA EMA moving averages of Dj Us DSNC
DMA (daily moving average) of Dj Us DSNC
| DMA period | DMA value | | 5 day DMA | 1030.05 | | 12 day DMA | 1013.59 | | 20 day DMA | 1009.61 | | 35 day DMA | 1021.42 | | 50 day DMA | 1024.92 | | 100 day DMA | 1001.97 | | 150 day DMA | 981.98 | | 200 day DMA | 962.59 | EMA (exponential moving average) of Dj Us DSNC
| EMA period | EMA current | EMA prev | EMA prev2 | | 5 day EMA | 1029.98 | 1027.88 | 1023.62 | | 12 day EMA | 1020.86 | 1018.44 | 1015.17 | | 20 day EMA | 1018.25 | 1016.58 | 1014.49 | | 35 day EMA | 1019.97 | 1019.13 | 1018.11 | | 50 day EMA | 1026.08 | 1025.75 | 1025.32 |
SMA (simple moving average) of Dj Us DSNC
| SMA period | SMA current | SMA prev | SMA prev2 | | 5 day SMA | 1030.05 | 1028.86 | 1026.08 | | 12 day SMA | 1013.59 | 1009.72 | 1005.67 | | 20 day SMA | 1009.61 | 1008.48 | 1008.01 | | 35 day SMA | 1021.42 | 1021.23 | 1021.12 | | 50 day SMA | 1024.92 | 1025.06 | 1024.89 | | 100 day SMA | 1001.97 | 1001.08 | 1000.19 | | 150 day SMA | 981.98 | 981.11 | 980.26 | | 200 day SMA | 962.59 | 962.25 | 961.9 |
|
|
