US DSMR full analysis,charts,indicators,moving averages,SMA,DMA,EMA,ADX,MACD,RSIU S DSMR WideScreen charts, DMA,SMA,EMA technical analysis, forecast prediction, by indicators ADX,MACD,RSI,CCI INDICES stock exchange
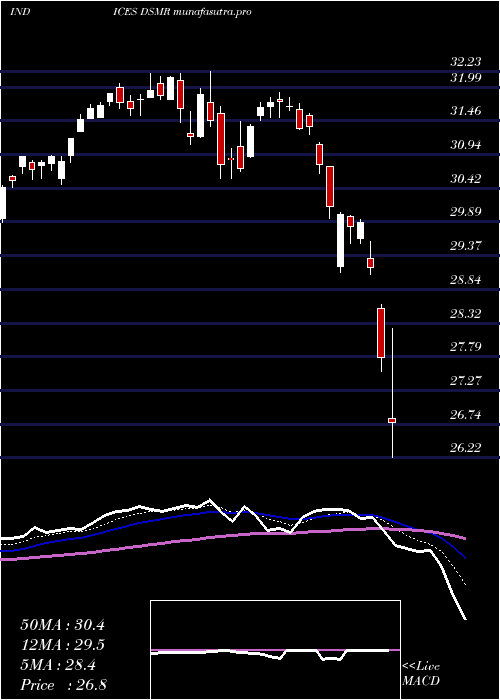
Daily price and charts and targets US Strong Daily Stock price targets for US DSMR are 31.39 and 31.76 | Daily Target 1 | 31.3 | | Daily Target 2 | 31.48 | | Daily Target 3 | 31.67 | | Daily Target 4 | 31.85 | | Daily Target 5 | 32.04 |
Daily price and volume U S
| Date |
Closing |
Open |
Range |
Volume |
Thu 04 December 2025 |
31.66 (-0.19%) |
31.80 |
31.49 - 31.86 |
0.768 times |
Wed 03 December 2025 |
31.72 (0.35%) |
31.73 |
31.65 - 31.86 |
0.8061 times |
Tue 02 December 2025 |
31.61 (-0.44%) |
31.78 |
31.58 - 31.83 |
0.7983 times |
Mon 01 December 2025 |
31.75 (0.03%) |
31.54 |
31.53 - 31.81 |
0.9443 times |
Fri 28 November 2025 |
31.74 (0%) |
31.72 |
31.66 - 31.87 |
0.6531 times |
Wed 26 November 2025 |
31.74 (1.08%) |
31.46 |
31.46 - 31.95 |
1.2353 times |
Tue 25 November 2025 |
31.40 (2.15%) |
30.93 |
30.86 - 31.44 |
1.5038 times |
Mon 24 November 2025 |
30.74 (-0.13%) |
30.83 |
30.59 - 30.90 |
1.2635 times |
Fri 21 November 2025 |
30.78 (1.92%) |
30.27 |
30.25 - 30.92 |
1.1061 times |
Thu 20 November 2025 |
30.20 (-0.13%) |
30.39 |
30.18 - 30.62 |
0.9213 times |
Wed 19 November 2025 |
30.24 (-0.13%) |
30.30 |
30.11 - 30.34 |
0.6995 times |
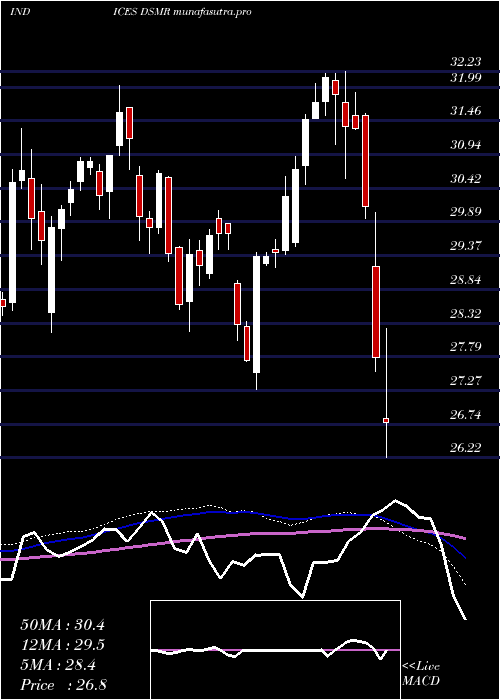
Weekly price and charts US Strong weekly Stock price targets for US DSMR are 31.58 and 31.95 | Weekly Target 1 | 31.3 | | Weekly Target 2 | 31.48 | | Weekly Target 3 | 31.67 | | Weekly Target 4 | 31.85 | | Weekly Target 5 | 32.04 |
Weekly price and volumes for U S
| Date |
Closing |
Open |
Range |
Volume |
Thu 04 December 2025 |
31.66 (-0.25%) |
31.54 |
31.49 - 31.86 |
0.7897 times |
Fri 28 November 2025 |
31.74 (3.12%) |
30.83 |
30.59 - 31.95 |
1.1085 times |
Fri 21 November 2025 |
30.78 (0.85%) |
30.57 |
30.04 - 30.92 |
1.0856 times |
Fri 14 November 2025 |
30.52 (-1.39%) |
30.95 |
30.40 - 31.03 |
1.1311 times |
Fri 07 November 2025 |
30.95 (2.59%) |
30.19 |
30.13 - 30.95 |
1.0015 times |
Fri 31 October 2025 |
30.17 (0%) |
29.85 |
29.59 - 30.22 |
0.27 times |
Fri 31 October 2025 |
30.17 (-0.46%) |
30.47 |
29.59 - 30.59 |
1.3646 times |
Fri 24 October 2025 |
30.31 (1.03%) |
30.04 |
29.89 - 30.61 |
1.1487 times |
Fri 17 October 2025 |
30.00 (1.08%) |
29.87 |
29.57 - 30.31 |
1.0262 times |
Fri 10 October 2025 |
29.68 (-2.5%) |
30.38 |
29.65 - 30.49 |
1.0741 times |
Fri 03 October 2025 |
30.44 (-1.1%) |
30.83 |
29.73 - 30.84 |
0.931 times |
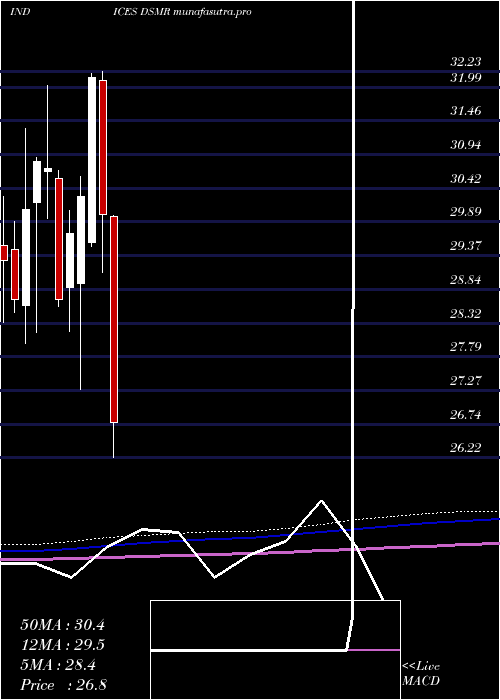
Monthly price and charts US Strong monthly Stock price targets for US DSMR are 31.58 and 31.95 | Monthly Target 1 | 31.3 | | Monthly Target 2 | 31.48 | | Monthly Target 3 | 31.67 | | Monthly Target 4 | 31.85 | | Monthly Target 5 | 32.04 |
Monthly price and volumes U S
| Date |
Closing |
Open |
Range |
Volume |
Thu 04 December 2025 |
31.66 (-0.25%) |
31.54 |
31.49 - 31.86 |
0.172 times |
Fri 28 November 2025 |
31.74 (5.2%) |
30.19 |
30.04 - 31.95 |
0.9424 times |
Fri 31 October 2025 |
30.17 (0.57%) |
29.90 |
29.57 - 30.61 |
1.1613 times |
Tue 30 September 2025 |
30.00 (-3.85%) |
30.86 |
29.73 - 32.67 |
1.1067 times |
Fri 29 August 2025 |
31.20 (3.76%) |
30.11 |
29.91 - 31.43 |
0.8147 times |
Thu 31 July 2025 |
30.07 (4.05%) |
28.85 |
28.78 - 31.01 |
0.98 times |
Mon 30 June 2025 |
28.90 (1.05%) |
28.40 |
28.17 - 29.65 |
0.9683 times |
Fri 30 May 2025 |
28.60 (-0.38%) |
29.05 |
27.81 - 29.75 |
1.3456 times |
Wed 30 April 2025 |
28.71 (-4.3%) |
29.98 |
24.64 - 29.99 |
1.5669 times |
Mon 31 March 2025 |
30.00 (-6.66%) |
32.09 |
29.10 - 32.23 |
0.9422 times |
Fri 28 February 2025 |
32.14 (6.11%) |
29.57 |
29.51 - 32.20 |
0.8832 times |
DMA SMA EMA moving averages of U S DSMR
DMA (daily moving average) of U S DSMR
| DMA period | DMA value | | 5 day DMA | 31.7 | | 12 day DMA | 31.16 | | 20 day DMA | 30.95 | | 35 day DMA | 30.65 | | 50 day DMA | 30.52 | | 100 day DMA | 30.74 | | 150 day DMA | 30.18 | | 200 day DMA | 30.15 | EMA (exponential moving average) of U S DSMR
| EMA period | EMA current | EMA prev | EMA prev2 | | 5 day EMA | 31.61 | 31.59 | 31.52 | | 12 day EMA | 31.3 | 31.24 | 31.15 | | 20 day EMA | 31.08 | 31.02 | 30.95 | | 35 day EMA | 30.87 | 30.82 | 30.77 | | 50 day EMA | 30.7 | 30.66 | 30.62 |
SMA (simple moving average) of U S DSMR
| SMA period | SMA current | SMA prev | SMA prev2 | | 5 day SMA | 31.7 | 31.71 | 31.65 | | 12 day SMA | 31.16 | 31.04 | 30.94 | | 20 day SMA | 30.95 | 30.91 | 30.85 | | 35 day SMA | 30.65 | 30.6 | 30.56 | | 50 day SMA | 30.52 | 30.51 | 30.49 | | 100 day SMA | 30.74 | 30.72 | 30.71 | | 150 day SMA | 30.18 | 30.16 | 30.14 | | 200 day SMA | 30.15 | 30.15 | 30.14 |
|
|
