DjUs DSIX full analysis,charts,indicators,moving averages,SMA,DMA,EMA,ADX,MACD,RSIDj Us DSIX WideScreen charts, DMA,SMA,EMA technical analysis, forecast prediction, by indicators ADX,MACD,RSI,CCI INDICES stock exchange
Daily price and charts and targets DjUs Strong Daily Stock price targets for DjUs DSIX are 1261.88 and 1274.16 | Daily Target 1 | 1258.87 | | Daily Target 2 | 1264.88 | | Daily Target 3 | 1271.1466666667 | | Daily Target 4 | 1277.16 | | Daily Target 5 | 1283.43 |
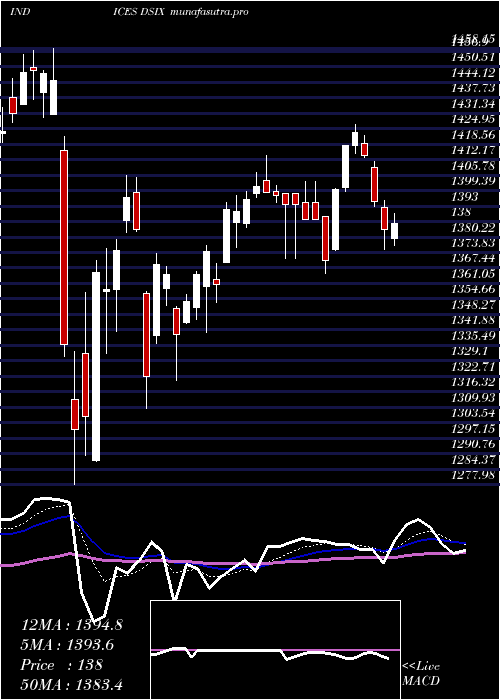
Daily price and volume Dj Us
| Date |
Closing |
Open |
Range |
Volume |
Mon 20 October 2025 |
1270.90 (-0.34%) |
1276.40 |
1265.13 - 1277.41 |
0.8694 times |
Fri 17 October 2025 |
1275.18 (0.8%) |
1266.29 |
1266.29 - 1277.70 |
1.2679 times |
Thu 16 October 2025 |
1265.12 (-3.95%) |
1294.66 |
1262.02 - 1294.66 |
1.6695 times |
Wed 15 October 2025 |
1317.13 (-2.62%) |
1333.92 |
1306.20 - 1334.92 |
1.2784 times |
Tue 14 October 2025 |
1352.54 (1.43%) |
1335.91 |
1335.02 - 1352.93 |
0.7648 times |
Mon 13 October 2025 |
1333.51 (-0.53%) |
1334.38 |
1329.77 - 1339.97 |
0.7545 times |
Fri 10 October 2025 |
1340.64 (-0.65%) |
1355.56 |
1339.78 - 1357.51 |
0.9232 times |
Thu 09 October 2025 |
1349.40 (-1.11%) |
1367.29 |
1346.49 - 1368.78 |
0.8584 times |
Wed 08 October 2025 |
1364.54 (-0.33%) |
1371.07 |
1363.85 - 1373.84 |
0.7417 times |
Tue 07 October 2025 |
1368.99 (0.83%) |
1360.48 |
1360.26 - 1369.76 |
0.8723 times |
Mon 06 October 2025 |
1357.73 (-0.11%) |
1358.91 |
1352.87 - 1363.26 |
0.8919 times |
Weekly price and charts DjUs Strong weekly Stock price targets for DjUs DSIX are 1261.88 and 1274.16 | Weekly Target 1 | 1258.87 | | Weekly Target 2 | 1264.88 | | Weekly Target 3 | 1271.1466666667 | | Weekly Target 4 | 1277.16 | | Weekly Target 5 | 1283.43 |
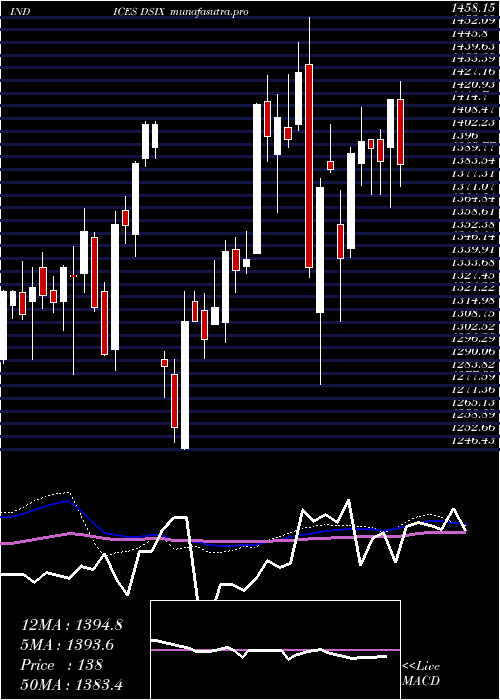
Weekly price and volumes for Dj Us
| Date |
Closing |
Open |
Range |
Volume |
Mon 20 October 2025 |
1270.90 (-0.34%) |
1276.40 |
1265.13 - 1277.41 |
0.2311 times |
Fri 17 October 2025 |
1275.18 (-4.88%) |
1334.38 |
1262.02 - 1352.93 |
1.5242 times |
Fri 10 October 2025 |
1340.64 (-1.36%) |
1358.91 |
1339.78 - 1373.84 |
1.1394 times |
Fri 03 October 2025 |
1359.16 (1.53%) |
1337.09 |
1327.71 - 1364.62 |
0.8887 times |
Fri 26 September 2025 |
1338.63 (1.58%) |
1313.55 |
1311.55 - 1345.71 |
1.1654 times |
Fri 19 September 2025 |
1317.84 (-1.78%) |
1341.78 |
1303.73 - 1343.30 |
1.7561 times |
Fri 12 September 2025 |
1341.76 (0.56%) |
1332.31 |
1315.77 - 1349.60 |
1.1548 times |
Fri 05 September 2025 |
1334.27 (-0.48%) |
1340.69 |
1328.60 - 1357.16 |
0.8859 times |
Fri 29 August 2025 |
1340.68 (0%) |
1338.90 |
1337.44 - 1346.58 |
0.1988 times |
Fri 29 August 2025 |
1340.68 (-1.3%) |
1353.77 |
1328.62 - 1354.74 |
1.0555 times |
Fri 22 August 2025 |
1358.31 (2.13%) |
1326.74 |
1324.20 - 1370.69 |
1.0796 times |
Monthly price and charts DjUs Strong monthly Stock price targets for DjUs DSIX are 1210.55 and 1322.37 | Monthly Target 1 | 1190.43 | | Monthly Target 2 | 1230.67 | | Monthly Target 3 | 1302.2533333333 | | Monthly Target 4 | 1342.49 | | Monthly Target 5 | 1414.07 |
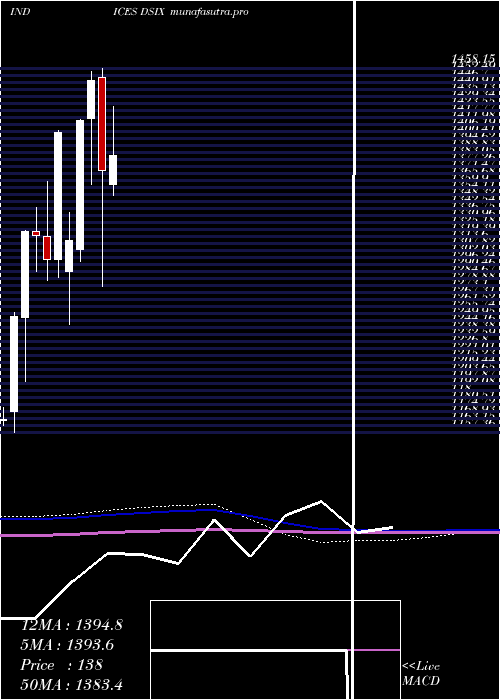
Monthly price and volumes Dj Us
| Date |
Closing |
Open |
Range |
Volume |
Mon 20 October 2025 |
1270.90 (-5.77%) |
1342.67 |
1262.02 - 1373.84 |
0.6742 times |
Tue 30 September 2025 |
1348.75 (0.6%) |
1340.69 |
1303.73 - 1357.16 |
1.0873 times |
Fri 29 August 2025 |
1340.68 (3.5%) |
1292.55 |
1276.00 - 1370.69 |
1.0047 times |
Thu 31 July 2025 |
1295.31 (-5.75%) |
1369.99 |
1284.02 - 1378.36 |
1.2174 times |
Mon 30 June 2025 |
1374.38 (-3.53%) |
1414.30 |
1341.39 - 1440.81 |
1.0663 times |
Fri 30 May 2025 |
1424.74 (3.69%) |
1362.60 |
1353.17 - 1428.36 |
1.0075 times |
Wed 30 April 2025 |
1373.98 (-5.13%) |
1450.31 |
1277.98 - 1458.15 |
1.0535 times |
Mon 31 March 2025 |
1448.21 (2.33%) |
1417.01 |
1362.67 - 1455.41 |
0.9889 times |
Fri 28 February 2025 |
1415.21 (7.53%) |
1308.59 |
1298.94 - 1416.08 |
0.9078 times |
Fri 31 January 2025 |
1316.08 (-6.36%) |
1290.52 |
1246.43 - 1339.10 |
0.9923 times |
Tue 26 November 2024 |
1405.48 (8.11%) |
1300.71 |
1285.31 - 1406.98 |
0.8311 times |
DMA SMA EMA moving averages of Dj Us DSIX
DMA (daily moving average) of Dj Us DSIX
| DMA period | DMA value | | 5 day DMA | 1296.17 | | 12 day DMA | 1329.57 | | 20 day DMA | 1330.84 | | 35 day DMA | 1330.8 | | 50 day DMA | 1333.41 | | 100 day DMA | 1342.59 | | 150 day DMA | 1358.36 | | 200 day DMA | 1353.19 | EMA (exponential moving average) of Dj Us DSIX
| EMA period | EMA current | EMA prev | EMA prev2 | | 5 day EMA | 1290.69 | 1300.59 | 1313.3 | | 12 day EMA | 1313.66 | 1321.43 | 1329.84 | | 20 day EMA | 1322.17 | 1327.56 | 1333.07 | | 35 day EMA | 1327.67 | 1331.01 | 1334.3 | | 50 day EMA | 1327.31 | 1329.61 | 1331.83 |
SMA (simple moving average) of Dj Us DSIX
| SMA period | SMA current | SMA prev | SMA prev2 | | 5 day SMA | 1296.17 | 1308.7 | 1321.79 | | 12 day SMA | 1329.57 | 1335.68 | 1341.81 | | 20 day SMA | 1330.84 | 1333.19 | 1335.32 | | 35 day SMA | 1330.8 | 1332.79 | 1334.56 | | 50 day SMA | 1333.41 | 1334.33 | 1335.04 | | 100 day SMA | 1342.59 | 1343.83 | 1345.21 | | 150 day SMA | 1358.36 | 1359.25 | 1360.26 | | 200 day SMA | 1353.19 | 1353.59 | 1354.03 |
|
|
