DjUs DSIU full analysis,charts,indicators,moving averages,SMA,DMA,EMA,ADX,MACD,RSIDj Us DSIU WideScreen charts, DMA,SMA,EMA technical analysis, forecast prediction, by indicators ADX,MACD,RSI,CCI INDICES stock exchange
Daily price and charts and targets DjUs Strong Daily Stock price targets for DjUs DSIU are 517.48 and 523.48 | Daily Target 1 | 512.77 | | Daily Target 2 | 516.19 | | Daily Target 3 | 518.76666666667 | | Daily Target 4 | 522.19 | | Daily Target 5 | 524.77 |
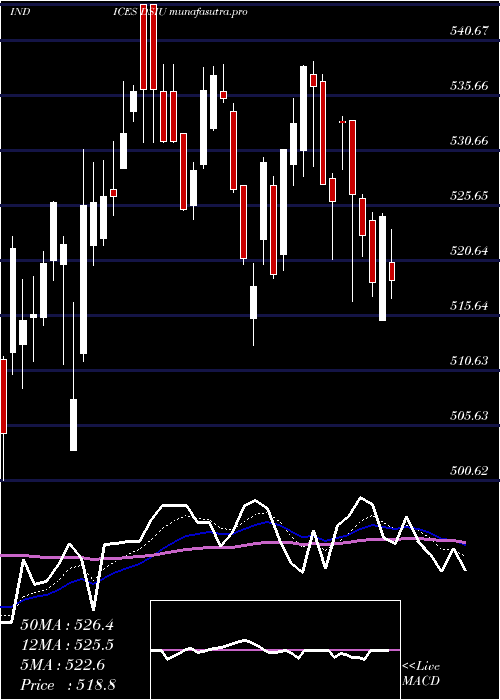
Daily price and volume Dj Us
| Date |
Closing |
Open |
Range |
Volume |
Thu 04 December 2025 |
519.62 (0.81%) |
516.91 |
515.34 - 521.34 |
1.0226 times |
Wed 03 December 2025 |
515.43 (-0.2%) |
517.87 |
513.91 - 520.59 |
1.0537 times |
Tue 02 December 2025 |
516.46 (0.13%) |
515.83 |
512.64 - 518.55 |
1.1049 times |
Mon 01 December 2025 |
515.78 (0.59%) |
513.92 |
513.92 - 519.54 |
1.0376 times |
Fri 28 November 2025 |
512.74 (0.12%) |
510.60 |
510.27 - 516.92 |
0.4679 times |
Wed 26 November 2025 |
512.11 (-0.18%) |
511.90 |
511.37 - 516.66 |
0.7839 times |
Tue 25 November 2025 |
513.02 (1.79%) |
506.60 |
506.60 - 515.67 |
1.1863 times |
Mon 24 November 2025 |
503.99 (-0.43%) |
503.29 |
499.04 - 504.38 |
1.2573 times |
Fri 21 November 2025 |
506.16 (0.59%) |
504.28 |
502.43 - 513.32 |
1.1491 times |
Thu 20 November 2025 |
503.18 (-1.49%) |
513.03 |
502.05 - 515.02 |
0.9368 times |
Wed 19 November 2025 |
510.77 (-1.03%) |
515.18 |
508.46 - 519.41 |
0.9715 times |
Weekly price and charts DjUs Strong weekly Stock price targets for DjUs DSIU are 516.13 and 524.83 | Weekly Target 1 | 509.17 | | Weekly Target 2 | 514.39 | | Weekly Target 3 | 517.86666666667 | | Weekly Target 4 | 523.09 | | Weekly Target 5 | 526.57 |
Weekly price and volumes for Dj Us
| Date |
Closing |
Open |
Range |
Volume |
Thu 04 December 2025 |
519.62 (1.34%) |
513.92 |
512.64 - 521.34 |
0.9162 times |
Fri 28 November 2025 |
512.74 (1.3%) |
503.29 |
499.04 - 516.92 |
0.8026 times |
Fri 21 November 2025 |
506.16 (-2.66%) |
522.38 |
502.05 - 522.95 |
1.0322 times |
Fri 14 November 2025 |
519.98 (-1%) |
522.83 |
517.88 - 527.63 |
0.9948 times |
Fri 07 November 2025 |
525.21 (4.67%) |
500.35 |
499.37 - 527.13 |
1.1466 times |
Fri 31 October 2025 |
501.77 (0%) |
504.70 |
498.34 - 510.86 |
0.4533 times |
Fri 31 October 2025 |
501.77 (-3.63%) |
519.99 |
485.02 - 524.28 |
1.7887 times |
Fri 24 October 2025 |
520.69 (-0.64%) |
526.12 |
515.79 - 527.18 |
0.8201 times |
Fri 17 October 2025 |
524.06 (-1.58%) |
529.91 |
518.57 - 546.35 |
1.0812 times |
Fri 10 October 2025 |
532.47 (-1.85%) |
545.60 |
531.52 - 558.57 |
0.9643 times |
Fri 03 October 2025 |
542.53 (2.99%) |
526.60 |
519.51 - 545.37 |
0.7401 times |
Monthly price and charts DjUs Strong monthly Stock price targets for DjUs DSIU are 516.13 and 524.83 | Monthly Target 1 | 509.17 | | Monthly Target 2 | 514.39 | | Monthly Target 3 | 517.86666666667 | | Monthly Target 4 | 523.09 | | Monthly Target 5 | 526.57 |
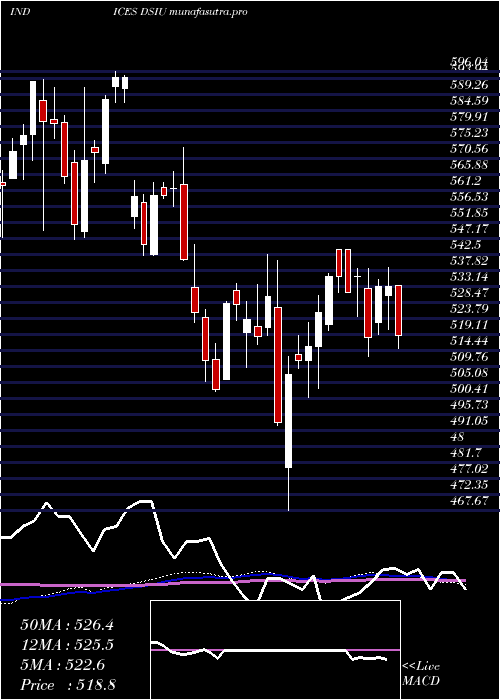
Monthly price and volumes Dj Us
| Date |
Closing |
Open |
Range |
Volume |
Thu 04 December 2025 |
519.62 (1.34%) |
513.92 |
512.64 - 521.34 |
0.2084 times |
Fri 28 November 2025 |
512.74 (2.19%) |
500.35 |
499.04 - 527.63 |
0.9046 times |
Fri 31 October 2025 |
501.77 (-5.41%) |
531.26 |
485.02 - 558.57 |
1.2487 times |
Tue 30 September 2025 |
530.49 (1.81%) |
519.89 |
500.45 - 533.49 |
1.1732 times |
Fri 29 August 2025 |
521.08 (0.97%) |
505.91 |
487.88 - 531.56 |
0.9034 times |
Thu 31 July 2025 |
516.07 (-1.11%) |
522.30 |
504.37 - 528.35 |
1.0185 times |
Mon 30 June 2025 |
521.88 (-2.1%) |
530.66 |
513.91 - 538.76 |
1.0175 times |
Fri 30 May 2025 |
533.10 (2.12%) |
503.42 |
503.42 - 544.00 |
1.2816 times |
Wed 30 April 2025 |
522.05 (-1.58%) |
531.02 |
467.67 - 540.65 |
1.1043 times |
Mon 31 March 2025 |
530.44 (0.39%) |
532.01 |
509.44 - 542.51 |
1.1398 times |
Fri 28 February 2025 |
528.37 (-2.34%) |
533.03 |
502.43 - 545.63 |
1.3383 times |

DMA SMA EMA moving averages of Dj Us DSIU
DMA (daily moving average) of Dj Us DSIU
| DMA period | DMA value | | 5 day DMA | 516.01 | | 12 day DMA | 512.11 | | 20 day DMA | 515.51 | | 35 day DMA | 514.44 | | 50 day DMA | 520.85 | | 100 day DMA | 517.59 | | 150 day DMA | 520.14 | | 200 day DMA | 519.54 | EMA (exponential moving average) of Dj Us DSIU
| EMA period | EMA current | EMA prev | EMA prev2 | | 5 day EMA | 516.17 | 514.44 | 513.95 | | 12 day EMA | 514.51 | 513.58 | 513.24 | | 20 day EMA | 514.61 | 514.08 | 513.94 | | 35 day EMA | 517.21 | 517.07 | 517.17 | | 50 day EMA | 519.53 | 519.53 | 519.7 |
SMA (simple moving average) of Dj Us DSIU
| SMA period | SMA current | SMA prev | SMA prev2 | | 5 day SMA | 516.01 | 514.5 | 514.02 | | 12 day SMA | 512.11 | 511.48 | 511.86 | | 20 day SMA | 515.51 | 515.47 | 515.33 | | 35 day SMA | 514.44 | 514.84 | 515.69 | | 50 day SMA | 520.85 | 520.74 | 520.62 | | 100 day SMA | 517.59 | 517.59 | 517.62 | | 150 day SMA | 520.14 | 520.18 | 520.21 | | 200 day SMA | 519.54 | 519.64 | 519.74 |
|
|
