DjUs DSIT full analysis,charts,indicators,moving averages,SMA,DMA,EMA,ADX,MACD,RSIDj Us DSIT WideScreen charts, DMA,SMA,EMA technical analysis, forecast prediction, by indicators ADX,MACD,RSI,CCI INDICES stock exchange
Daily price and charts and targets DjUs Strong Daily Stock price targets for DjUs DSIT are 1565.38 and 1584.3 | Daily Target 1 | 1550.53 | | Daily Target 2 | 1561.31 | | Daily Target 3 | 1569.4533333333 | | Daily Target 4 | 1580.23 | | Daily Target 5 | 1588.37 |
Daily price and volume Dj Us
| Date |
Closing |
Open |
Range |
Volume |
Thu 04 December 2025 |
1572.08 (0.17%) |
1571.09 |
1558.68 - 1577.60 |
1.2076 times |
Wed 03 December 2025 |
1569.48 (1.84%) |
1544.24 |
1544.24 - 1570.89 |
1.2141 times |
Tue 02 December 2025 |
1541.11 (0.28%) |
1537.14 |
1525.21 - 1544.92 |
1.1055 times |
Mon 01 December 2025 |
1536.79 (-0.11%) |
1536.06 |
1533.65 - 1554.38 |
1.0293 times |
Fri 28 November 2025 |
1538.44 (0.28%) |
1533.41 |
1532.40 - 1543.79 |
0.3521 times |
Wed 26 November 2025 |
1534.20 (0.77%) |
1519.88 |
1519.88 - 1540.48 |
0.715 times |
Tue 25 November 2025 |
1522.54 (2.05%) |
1496.49 |
1496.49 - 1525.80 |
0.8928 times |
Mon 24 November 2025 |
1491.90 (-0.48%) |
1498.91 |
1483.83 - 1499.83 |
1.1803 times |
Fri 21 November 2025 |
1499.04 (3%) |
1462.98 |
1460.76 - 1509.07 |
1.2528 times |
Thu 20 November 2025 |
1455.32 (-0.62%) |
1470.75 |
1454.64 - 1487.85 |
1.0505 times |
Wed 19 November 2025 |
1464.33 (-0.31%) |
1469.95 |
1461.93 - 1479.20 |
0.9401 times |
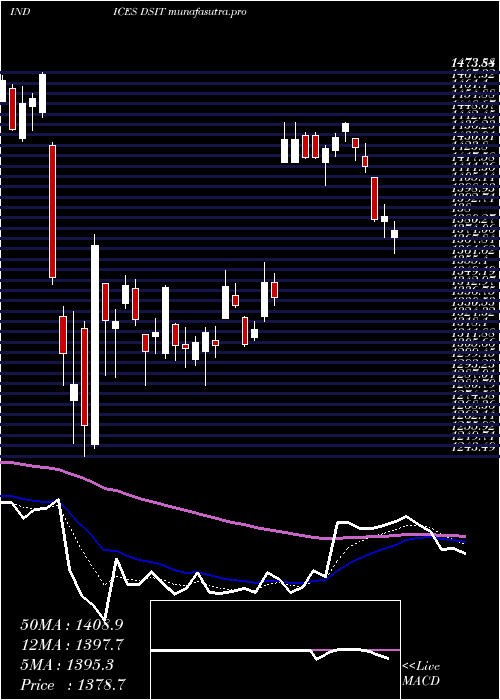
Weekly price and charts DjUs Strong weekly Stock price targets for DjUs DSIT are 1548.65 and 1601.04 | Weekly Target 1 | 1505.91 | | Weekly Target 2 | 1538.99 | | Weekly Target 3 | 1558.2966666667 | | Weekly Target 4 | 1591.38 | | Weekly Target 5 | 1610.69 |
Weekly price and volumes for Dj Us
| Date |
Closing |
Open |
Range |
Volume |
Thu 04 December 2025 |
1572.08 (2.19%) |
1536.06 |
1525.21 - 1577.60 |
1.0168 times |
Fri 28 November 2025 |
1538.44 (2.63%) |
1498.91 |
1483.83 - 1543.79 |
0.7007 times |
Fri 21 November 2025 |
1499.04 (0.34%) |
1490.01 |
1454.64 - 1509.07 |
1.2381 times |
Fri 14 November 2025 |
1493.92 (-0.44%) |
1499.01 |
1482.06 - 1522.87 |
1.039 times |
Fri 07 November 2025 |
1500.52 (0.37%) |
1474.43 |
1471.71 - 1501.12 |
0.8883 times |
Fri 31 October 2025 |
1494.94 (0%) |
1473.69 |
1463.77 - 1498.92 |
0.2556 times |
Fri 31 October 2025 |
1494.94 (4.15%) |
1447.07 |
1440.46 - 1498.92 |
1.3671 times |
Fri 24 October 2025 |
1435.32 (-1.85%) |
1465.24 |
1432.72 - 1486.97 |
1.1203 times |
Fri 17 October 2025 |
1462.30 (2.95%) |
1425.78 |
1414.29 - 1470.23 |
1.1793 times |
Fri 10 October 2025 |
1420.36 (-4.3%) |
1486.28 |
1419.54 - 1498.63 |
1.1946 times |
Fri 03 October 2025 |
1484.12 (2.23%) |
1458.21 |
1449.43 - 1492.61 |
1.0963 times |
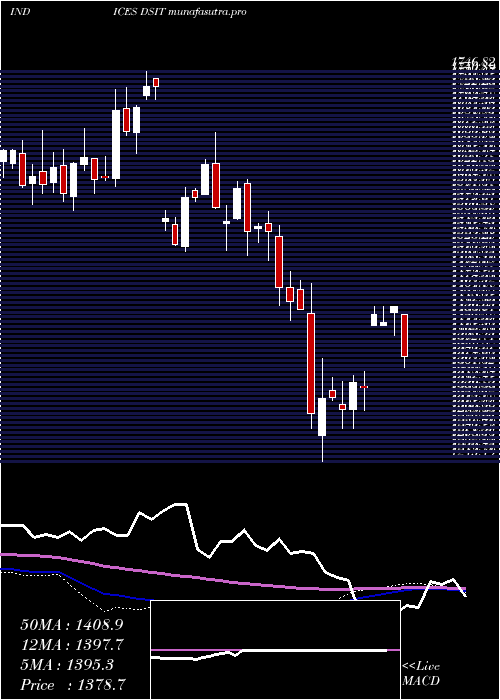
Monthly price and charts DjUs Strong monthly Stock price targets for DjUs DSIT are 1548.65 and 1601.04 | Monthly Target 1 | 1505.91 | | Monthly Target 2 | 1538.99 | | Monthly Target 3 | 1558.2966666667 | | Monthly Target 4 | 1591.38 | | Monthly Target 5 | 1610.69 |
Monthly price and volumes Dj Us
| Date |
Closing |
Open |
Range |
Volume |
Thu 04 December 2025 |
1572.08 (2.19%) |
1536.06 |
1525.21 - 1577.60 |
0.2223 times |
Fri 28 November 2025 |
1538.44 (2.91%) |
1474.43 |
1454.64 - 1543.79 |
0.8453 times |
Fri 31 October 2025 |
1494.94 (2.05%) |
1458.78 |
1414.29 - 1498.92 |
1.2247 times |
Tue 30 September 2025 |
1464.95 (2.5%) |
1414.47 |
1373.71 - 1468.93 |
1.1905 times |
Fri 29 August 2025 |
1429.27 (0.51%) |
1411.30 |
1393.08 - 1494.30 |
1.3366 times |
Thu 31 July 2025 |
1422.04 (-1.46%) |
1443.03 |
1416.01 - 1517.35 |
1.1746 times |
Mon 30 June 2025 |
1443.17 (3.62%) |
1392.16 |
1366.92 - 1453.50 |
0.9159 times |
Fri 30 May 2025 |
1392.80 (5.68%) |
1313.13 |
1302.82 - 1443.70 |
1.1399 times |
Wed 30 April 2025 |
1317.92 (-9.45%) |
1453.07 |
1243.49 - 1473.88 |
1.0635 times |
Mon 31 March 2025 |
1455.45 (-5.95%) |
1550.87 |
1425.17 - 1565.90 |
0.8866 times |
Fri 28 February 2025 |
1547.50 (-1.57%) |
1550.70 |
1508.95 - 1607.65 |
0.8684 times |
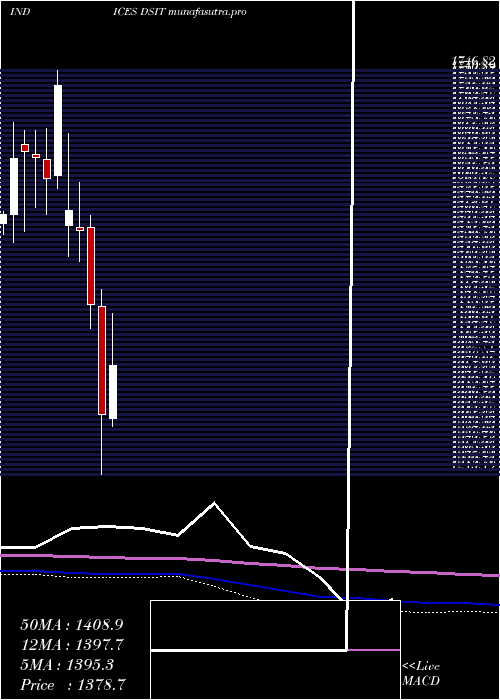
DMA SMA EMA moving averages of Dj Us DSIT
DMA (daily moving average) of Dj Us DSIT
| DMA period | DMA value | | 5 day DMA | 1551.58 | | 12 day DMA | 1516.18 | | 20 day DMA | 1507.4 | | 35 day DMA | 1489.94 | | 50 day DMA | 1480.03 | | 100 day DMA | 1457.67 | | 150 day DMA | 1442.25 | | 200 day DMA | 1446.1 | EMA (exponential moving average) of Dj Us DSIT
| EMA period | EMA current | EMA prev | EMA prev2 | | 5 day EMA | 1552.91 | 1543.33 | 1530.26 | | 12 day EMA | 1529.26 | 1521.48 | 1512.75 | | 20 day EMA | 1514.25 | 1508.16 | 1501.71 | | 35 day EMA | 1496.28 | 1491.82 | 1487.25 | | 50 day EMA | 1482.22 | 1478.55 | 1474.84 |
SMA (simple moving average) of Dj Us DSIT
| SMA period | SMA current | SMA prev | SMA prev2 | | 5 day SMA | 1551.58 | 1544 | 1534.62 | | 12 day SMA | 1516.18 | 1508 | 1501.7 | | 20 day SMA | 1507.4 | 1502.84 | 1498.96 | | 35 day SMA | 1489.94 | 1486.21 | 1482.6 | | 50 day SMA | 1480.03 | 1477.34 | 1474.41 | | 100 day SMA | 1457.67 | 1456.91 | 1456.06 | | 150 day SMA | 1442.25 | 1440.51 | 1438.77 | | 200 day SMA | 1446.1 | 1446.01 | 1445.89 |
|
|
