DjUs DSIR full analysis,charts,indicators,moving averages,SMA,DMA,EMA,ADX,MACD,RSIDj Us DSIR WideScreen charts, DMA,SMA,EMA technical analysis, forecast prediction, by indicators ADX,MACD,RSI,CCI INDICES stock exchange
Daily price and charts and targets DjUs Strong Daily Stock price targets for DjUs DSIR are 1303.7 and 1313.91 | Daily Target 1 | 1301.59 | | Daily Target 2 | 1305.8 | | Daily Target 3 | 1311.7966666667 | | Daily Target 4 | 1316.01 | | Daily Target 5 | 1322.01 |
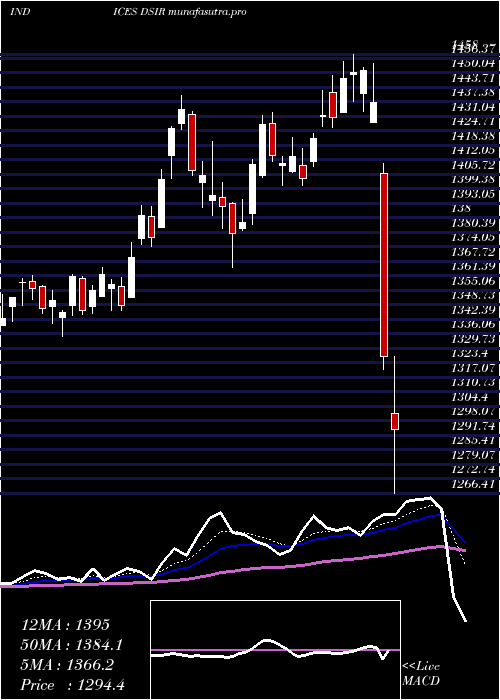
Daily price and volume Dj Us
| Date |
Closing |
Open |
Range |
Volume |
Thu 04 December 2025 |
1310.02 (-0.05%) |
1313.72 |
1307.58 - 1317.79 |
1.0421 times |
Wed 03 December 2025 |
1310.69 (-0.12%) |
1312.74 |
1303.41 - 1319.26 |
1.036 times |
Tue 02 December 2025 |
1312.26 (-0.46%) |
1318.54 |
1307.48 - 1319.13 |
1.0381 times |
Mon 01 December 2025 |
1318.32 (-0.59%) |
1324.54 |
1317.16 - 1332.04 |
1.0542 times |
Fri 28 November 2025 |
1326.08 (-0.14%) |
1326.69 |
1325.65 - 1334.23 |
0.4307 times |
Wed 26 November 2025 |
1327.96 (0.25%) |
1325.13 |
1325.13 - 1333.03 |
0.831 times |
Tue 25 November 2025 |
1324.60 (0.98%) |
1319.19 |
1318.42 - 1330.84 |
0.9103 times |
Mon 24 November 2025 |
1311.74 (-0.48%) |
1318.74 |
1305.22 - 1319.11 |
1.4638 times |
Fri 21 November 2025 |
1318.11 (0.93%) |
1312.62 |
1309.84 - 1328.74 |
1.1781 times |
Thu 20 November 2025 |
1305.99 (0.51%) |
1304.47 |
1298.11 - 1311.25 |
1.0159 times |
Wed 19 November 2025 |
1299.37 (-1.04%) |
1311.81 |
1294.58 - 1318.16 |
1.0062 times |
Weekly price and charts DjUs Strong weekly Stock price targets for DjUs DSIR are 1292.4 and 1321.03 | Weekly Target 1 | 1286.53 | | Weekly Target 2 | 1298.27 | | Weekly Target 3 | 1315.1566666667 | | Weekly Target 4 | 1326.9 | | Weekly Target 5 | 1343.79 |
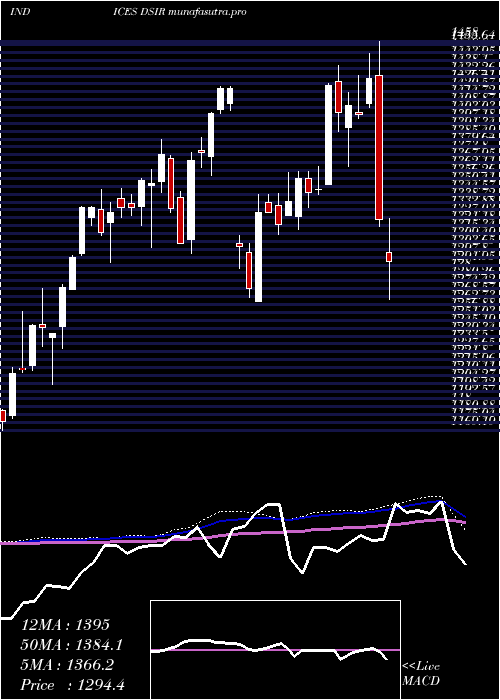
Weekly price and volumes for Dj Us
| Date |
Closing |
Open |
Range |
Volume |
Thu 04 December 2025 |
1310.02 (-1.21%) |
1324.54 |
1303.41 - 1332.04 |
0.8981 times |
Fri 28 November 2025 |
1326.08 (0.6%) |
1318.74 |
1305.22 - 1334.23 |
0.7829 times |
Fri 21 November 2025 |
1318.11 (-0.46%) |
1327.40 |
1294.58 - 1329.33 |
1.1342 times |
Fri 14 November 2025 |
1324.16 (2.05%) |
1290.55 |
1286.87 - 1333.61 |
1.0966 times |
Fri 07 November 2025 |
1297.56 (2.84%) |
1259.12 |
1259.12 - 1297.60 |
1.0663 times |
Fri 31 October 2025 |
1261.71 (0%) |
1251.66 |
1251.66 - 1265.68 |
0.3268 times |
Fri 31 October 2025 |
1261.71 (-2.45%) |
1292.68 |
1251.24 - 1296.03 |
1.4002 times |
Fri 24 October 2025 |
1293.34 (0.19%) |
1292.53 |
1282.74 - 1303.46 |
1.0538 times |
Fri 17 October 2025 |
1290.90 (-4.3%) |
1344.90 |
1278.08 - 1365.30 |
1.2586 times |
Fri 10 October 2025 |
1348.89 (-1.67%) |
1371.64 |
1348.11 - 1384.03 |
0.9824 times |
Fri 03 October 2025 |
1371.82 (1.36%) |
1352.12 |
1342.71 - 1376.24 |
0.8003 times |
Monthly price and charts DjUs Strong monthly Stock price targets for DjUs DSIR are 1292.4 and 1321.03 | Monthly Target 1 | 1286.53 | | Monthly Target 2 | 1298.27 | | Monthly Target 3 | 1315.1566666667 | | Monthly Target 4 | 1326.9 | | Monthly Target 5 | 1343.79 |
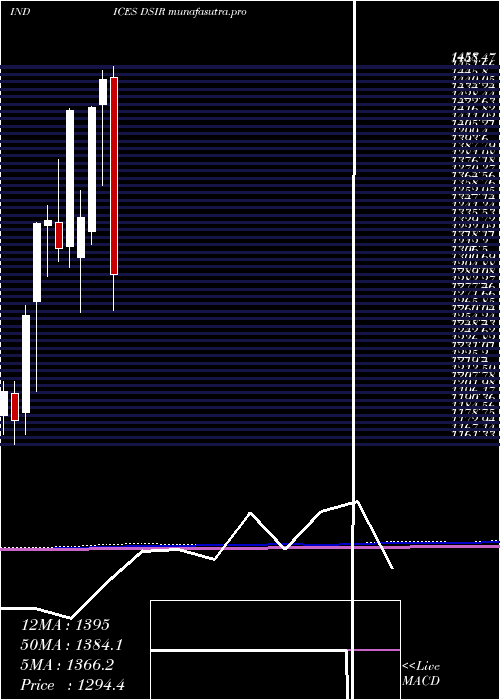
Monthly price and volumes Dj Us
| Date |
Closing |
Open |
Range |
Volume |
Thu 04 December 2025 |
1310.02 (-1.21%) |
1324.54 |
1303.41 - 1332.04 |
0.2067 times |
Fri 28 November 2025 |
1326.08 (5.1%) |
1259.12 |
1259.12 - 1334.23 |
0.939 times |
Fri 31 October 2025 |
1261.71 (-7.38%) |
1355.86 |
1251.24 - 1384.03 |
1.2489 times |
Tue 30 September 2025 |
1362.23 (0.72%) |
1351.08 |
1317.15 - 1367.61 |
1.1291 times |
Fri 29 August 2025 |
1352.50 (3.81%) |
1298.08 |
1280.12 - 1378.90 |
1.0429 times |
Thu 31 July 2025 |
1302.86 (-5.44%) |
1373.55 |
1288.95 - 1383.41 |
1.1877 times |
Mon 30 June 2025 |
1377.76 (-2.71%) |
1405.96 |
1344.41 - 1430.35 |
1.0564 times |
Fri 30 May 2025 |
1416.13 (3.26%) |
1358.87 |
1350.12 - 1424.61 |
1.053 times |
Wed 30 April 2025 |
1371.40 (-5.28%) |
1449.24 |
1266.41 - 1458.00 |
1.1163 times |
Mon 31 March 2025 |
1447.78 (1.55%) |
1428.06 |
1364.87 - 1455.09 |
1.0201 times |
Fri 28 February 2025 |
1425.64 (6.47%) |
1328.34 |
1318.40 - 1426.46 |
0.9543 times |
DMA SMA EMA moving averages of Dj Us DSIR
DMA (daily moving average) of Dj Us DSIR
| DMA period | DMA value | | 5 day DMA | 1315.47 | | 12 day DMA | 1314.85 | | 20 day DMA | 1312.16 | | 35 day DMA | 1298.42 | | 50 day DMA | 1315.93 | | 100 day DMA | 1325.77 | | 150 day DMA | 1343.73 | | 200 day DMA | 1353.13 | EMA (exponential moving average) of Dj Us DSIR
| EMA period | EMA current | EMA prev | EMA prev2 | | 5 day EMA | 1313.67 | 1315.5 | 1317.91 | | 12 day EMA | 1313.65 | 1314.31 | 1314.97 | | 20 day EMA | 1311.49 | 1311.64 | 1311.74 | | 35 day EMA | 1315.77 | 1316.11 | 1316.43 | | 50 day EMA | 1317.1 | 1317.39 | 1317.66 |
SMA (simple moving average) of Dj Us DSIR
| SMA period | SMA current | SMA prev | SMA prev2 | | 5 day SMA | 1315.47 | 1319.06 | 1321.84 | | 12 day SMA | 1314.85 | 1314.9 | 1316.02 | | 20 day SMA | 1312.16 | 1310.49 | 1309.05 | | 35 day SMA | 1298.42 | 1299.05 | 1300.59 | | 50 day SMA | 1315.93 | 1316.45 | 1316.87 | | 100 day SMA | 1325.77 | 1326.06 | 1326.37 | | 150 day SMA | 1343.73 | 1344.1 | 1344.4 | | 200 day SMA | 1353.13 | 1353.34 | 1353.5 |
|
|
