DjUs DSIQ full analysis,charts,indicators,moving averages,SMA,DMA,EMA,ADX,MACD,RSIDj Us DSIQ WideScreen charts, DMA,SMA,EMA technical analysis, forecast prediction, by indicators ADX,MACD,RSI,CCI INDICES stock exchange
Daily price and charts and targets DjUs Strong Daily Stock price targets for DjUs DSIQ are 4935.48 and 4992.64 | Daily Target 1 | 4890.95 | | Daily Target 2 | 4922.84 | | Daily Target 3 | 4948.1133333333 | | Daily Target 4 | 4980 | | Daily Target 5 | 5005.27 |
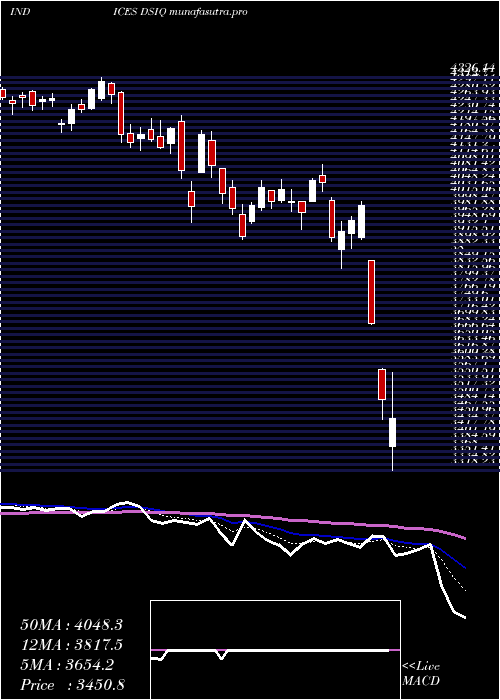
Daily price and volume Dj Us
| Date |
Closing |
Open |
Range |
Volume |
Thu 04 December 2025 |
4954.72 (0.57%) |
4918.20 |
4916.23 - 4973.39 |
0.9195 times |
Wed 03 December 2025 |
4926.40 (1.45%) |
4857.83 |
4830.87 - 4929.70 |
0.9287 times |
Tue 02 December 2025 |
4856.17 (0.76%) |
4836.51 |
4809.84 - 4873.61 |
1.0717 times |
Mon 01 December 2025 |
4819.55 (-0.67%) |
4828.27 |
4808.64 - 4873.06 |
1.0046 times |
Fri 28 November 2025 |
4851.87 (0.02%) |
4853.01 |
4842.26 - 4874.57 |
0.486 times |
Wed 26 November 2025 |
4851.01 (-0.15%) |
4851.47 |
4825.07 - 4878.07 |
1.2182 times |
Tue 25 November 2025 |
4858.17 (1.92%) |
4784.38 |
4758.42 - 4865.93 |
1.0239 times |
Mon 24 November 2025 |
4766.42 (0.43%) |
4753.74 |
4745.28 - 4811.88 |
1.2888 times |
Fri 21 November 2025 |
4746.00 (2.2%) |
4650.44 |
4637.52 - 4770.38 |
1.0695 times |
Thu 20 November 2025 |
4643.98 (-0.48%) |
4732.80 |
4624.52 - 4753.77 |
0.9892 times |
Wed 19 November 2025 |
4666.19 (0.42%) |
4651.79 |
4648.01 - 4699.31 |
0.8745 times |
Weekly price and charts DjUs Strong weekly Stock price targets for DjUs DSIQ are 4881.68 and 5046.43 | Weekly Target 1 | 4747.5 | | Weekly Target 2 | 4851.11 | | Weekly Target 3 | 4912.25 | | Weekly Target 4 | 5015.86 | | Weekly Target 5 | 5077 |
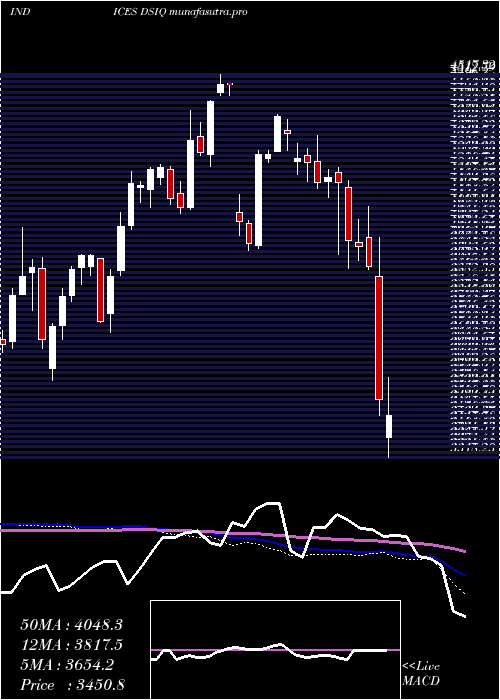
Weekly price and volumes for Dj Us
| Date |
Closing |
Open |
Range |
Volume |
Thu 04 December 2025 |
4954.72 (2.12%) |
4828.27 |
4808.64 - 4973.39 |
0.9558 times |
Fri 28 November 2025 |
4851.87 (2.23%) |
4753.74 |
4745.28 - 4878.07 |
0.9783 times |
Fri 21 November 2025 |
4746.00 (0.85%) |
4709.89 |
4605.00 - 4770.38 |
1.1673 times |
Fri 14 November 2025 |
4706.14 (-1.37%) |
4802.02 |
4682.47 - 4874.25 |
1.0744 times |
Fri 07 November 2025 |
4771.36 (0.88%) |
4660.29 |
4635.03 - 4852.76 |
1.0256 times |
Fri 31 October 2025 |
4729.93 (0%) |
4739.39 |
4706.99 - 4761.42 |
0.289 times |
Fri 31 October 2025 |
4729.93 (2.31%) |
4652.72 |
4606.41 - 4835.35 |
1.424 times |
Fri 24 October 2025 |
4623.12 (1.87%) |
4548.10 |
4543.68 - 4646.25 |
0.929 times |
Fri 17 October 2025 |
4538.11 (3.3%) |
4420.38 |
4389.99 - 4589.30 |
1.1714 times |
Fri 10 October 2025 |
4393.00 (-4.05%) |
4593.80 |
4390.21 - 4609.34 |
0.9853 times |
Fri 03 October 2025 |
4578.47 (2.3%) |
4488.77 |
4467.60 - 4616.56 |
0.7793 times |
Monthly price and charts DjUs Strong monthly Stock price targets for DjUs DSIQ are 4881.68 and 5046.43 | Monthly Target 1 | 4747.5 | | Monthly Target 2 | 4851.11 | | Monthly Target 3 | 4912.25 | | Monthly Target 4 | 5015.86 | | Monthly Target 5 | 5077 |
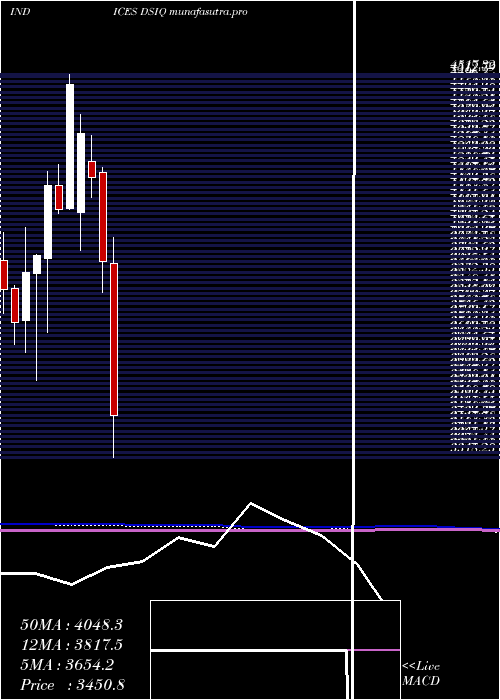
Monthly price and volumes Dj Us
| Date |
Closing |
Open |
Range |
Volume |
Thu 04 December 2025 |
4954.72 (2.12%) |
4828.27 |
4808.64 - 4973.39 |
0.2079 times |
Fri 28 November 2025 |
4851.87 (2.58%) |
4660.29 |
4605.00 - 4878.07 |
0.9235 times |
Fri 31 October 2025 |
4729.93 (4.97%) |
4495.96 |
4389.99 - 4835.35 |
1.1288 times |
Tue 30 September 2025 |
4506.12 (2.78%) |
4333.11 |
4297.93 - 4563.29 |
1.0398 times |
Fri 29 August 2025 |
4384.28 (-0.91%) |
4380.38 |
4283.46 - 4499.56 |
1.0188 times |
Thu 31 July 2025 |
4424.49 (4.57%) |
4219.68 |
4205.33 - 4453.28 |
1.2351 times |
Mon 30 June 2025 |
4231.03 (3.76%) |
4072.97 |
4004.32 - 4259.69 |
1.0566 times |
Fri 30 May 2025 |
4077.83 (7.88%) |
3805.79 |
3790.12 - 4209.56 |
1.2202 times |
Wed 30 April 2025 |
3779.98 (-3.85%) |
3925.55 |
3318.23 - 4007.18 |
1.162 times |
Mon 31 March 2025 |
3931.21 (-6.29%) |
4212.24 |
3836.56 - 4227.40 |
1.0073 times |
Fri 28 February 2025 |
4194.98 (-3.17%) |
4244.13 |
4131.68 - 4326.14 |
0.9896 times |
DMA SMA EMA moving averages of Dj Us DSIQ
DMA (daily moving average) of Dj Us DSIQ
| DMA period | DMA value | | 5 day DMA | 4881.74 | | 12 day DMA | 4798.93 | | 20 day DMA | 4783.85 | | 35 day DMA | 4725.94 | | 50 day DMA | 4657.98 | | 100 day DMA | 4526.88 | | 150 day DMA | 4389.36 | | 200 day DMA | 4284.48 | EMA (exponential moving average) of Dj Us DSIQ
| EMA period | EMA current | EMA prev | EMA prev2 | | 5 day EMA | 4892.58 | 4861.51 | 4829.07 | | 12 day EMA | 4832.32 | 4810.07 | 4788.93 | | 20 day EMA | 4790.86 | 4773.62 | 4757.54 | | 35 day EMA | 4724.61 | 4711.06 | 4698.38 | | 50 day EMA | 4666.72 | 4654.97 | 4643.9 |
SMA (simple moving average) of Dj Us DSIQ
| SMA period | SMA current | SMA prev | SMA prev2 | | 5 day SMA | 4881.74 | 4861 | 4847.35 | | 12 day SMA | 4798.93 | 4774 | 4755.65 | | 20 day SMA | 4783.85 | 4773.23 | 4759.58 | | 35 day SMA | 4725.94 | 4714.39 | 4703.12 | | 50 day SMA | 4657.98 | 4648.85 | 4640.39 | | 100 day SMA | 4526.88 | 4521.28 | 4515.5 | | 150 day SMA | 4389.36 | 4381.44 | 4373.64 | | 200 day SMA | 4284.48 | 4281.01 | 4277.76 |
|
|
